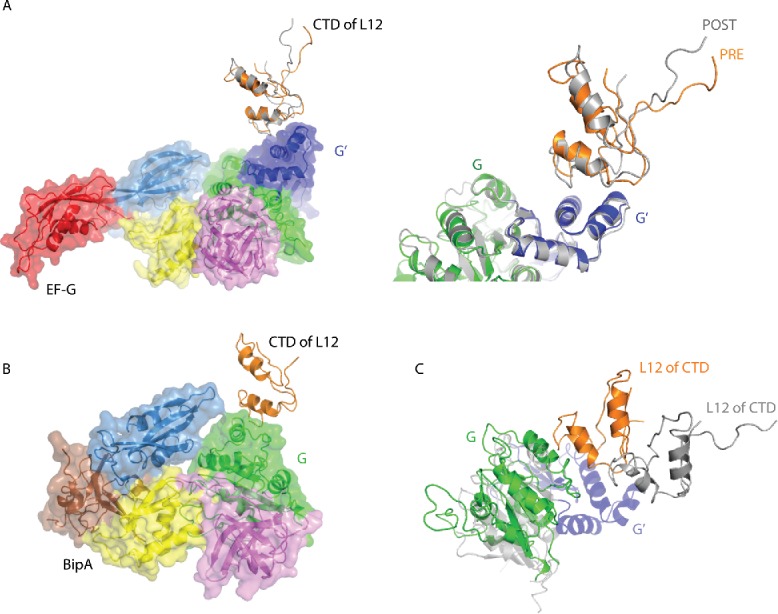
Figure 3.

Interaction of the CTD of the L10–L12 stalk protein L12 with EF-G and BipA. (A) Comparison of the CTD of L12 interaction with EF-G in PRE (PDB ID: 4V90) (EF-G colored as previously) and POST (PDB ID: 4V5F) (EF-G colored gray) complexes. The CTD of L12 in PRE complex is shown in orange. Close-up of the EF-G G' domain and the CTD of L12 interaction interface is shown right. (B) CTD of L12 interaction with BipA G domain (PDB ID: 5A9Z). (C) Comparison of CTD of L12 interaction with EF-G in POST complex (PDB ID: 4V5F) and BipA (PDB ID: 5A9Z) by aligning the 23S rRNAs. BipA is colored as previously; POST complex is colored gray with G' domain unique to EF-G highlighted in blue.
