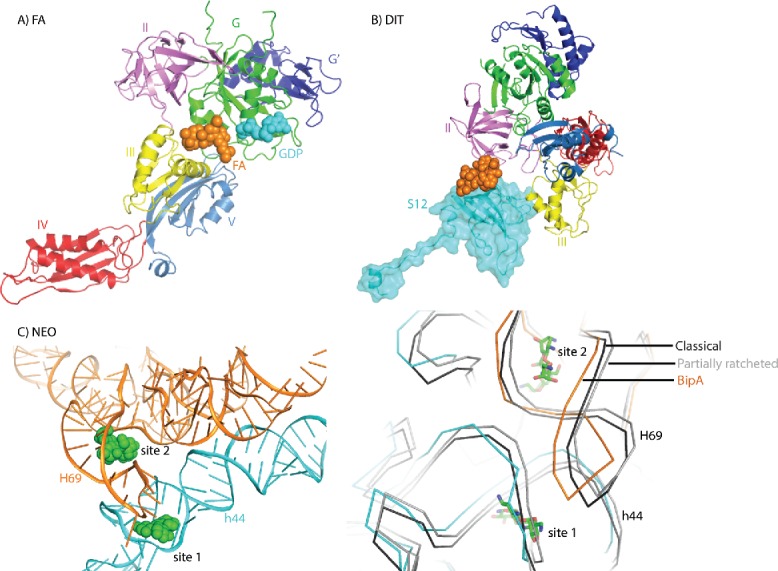
Figure 5.

Interplay between ribosome, trGTPases, and antibiotics. (A) Fusidic acid interaction with ribosome bound EF-G (PDB ID: 4V5F). Fusidic acid is shown in orange spheres. GDP bound to EF-G G domain is shown in cyan spheres. (B) Dityromycin interaction with ribosomal protein S12 in the compact EF-G-ribosome structure (PDB ID: 4WQU). Dityromycin is shown in orange spheres and ribosomal protein S12 is highlighted in cyan. (C) Neomycin interaction with ribosome in the BipA-ribosome complex structure (PDB ID: 5A9Z) (left). Neomycin is shown in green spheres. 16S and 23S rRNA are shown in cyan and orange, respectively. Comparison of the neomycin binding sites in the rotated ribosome in complex with BipA (PDB ID: 5A9Z) (same coloring), unrotated ribosome (black) in complex with RRF (PDB ID: 4V54) and partially rotated (gray) ribosome (PDB ID: 4V9C) (right). For clarity, only rRNA backbone is shown. Neomycin is shown in green sticks.
