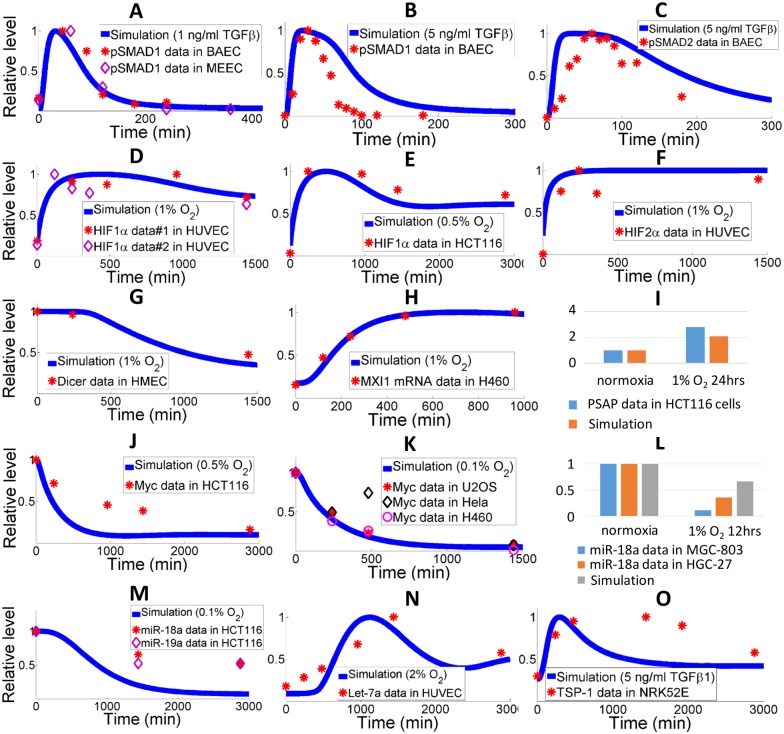
Fig 4. Qualitative model validation against experimental data in different cell types.
(A-C) Experimental data (symbols) of total phosphorylated SMAD1 and SMAD2 protein in BAECs and mouse embryonic ECs when stimulated by different amount of TGFβ [71, 72]. Model simulations are presented by solid curves. (D-F) HIF1/2 protein expression data (symbols) measured in HUVECs and HCT116 colon carcinoma cells at different oxygen tensions [59, 75, 76]. Model simulations presented by solid curves show rapid induction of HIFs in hypoxia. (G) Dicer protein level (symbols) is decreased in hypoxia (1% O2) and measured in human dermal microvascular ECs [59]. Model simulation is presented by the solid curve. (H-I) Data on MXI-1 mRNA in H460 lung cancer cells and PSAP protein in HCT116 colon carcinoma cells indicate upregulation of both molecules in hypoxia [77, 78]. Model simulations confirm the trend. (J-K) Data on Myc protein in hypoxic conditions (symbols) in HCT116 cells, H460 cells, U2OS osteosarcoma cells and Hela cells [75, 77]. The downregulation of Myc is also captured by model simulations (solid curves). (L-M) Levels of miR-18a quantified in HCT116 cells, MGC-803 and HGC-27 gastric carcinoma cells [21, 79]. Model simulation of miR-18a downregulation in hypoxia agrees with experimental findings. The expression of miR-19a, another miR that potentially targets TSP-1, is also downregulated in hypoxia [19]. (N) Let-7a, together with other members of the let-7 miR family, belongs to the HRM group, and its induction is captured by model simulation (solid curve) and supported by experimental data (symbols) in HUVECs [23]. (O) Experimental data (symbols) in NRK52E rat kidney cells indicate that TSP-1 protein expression is stimulated by TGFβ signals [27]. Model simulation is shown by the solid curve. (A-O) Experimental data-point values and simulation curves are all normalized with respect to the peaks (or normoxic values in the bar-graphs). Literature data are quantified by ImageJ following standard protocols.

