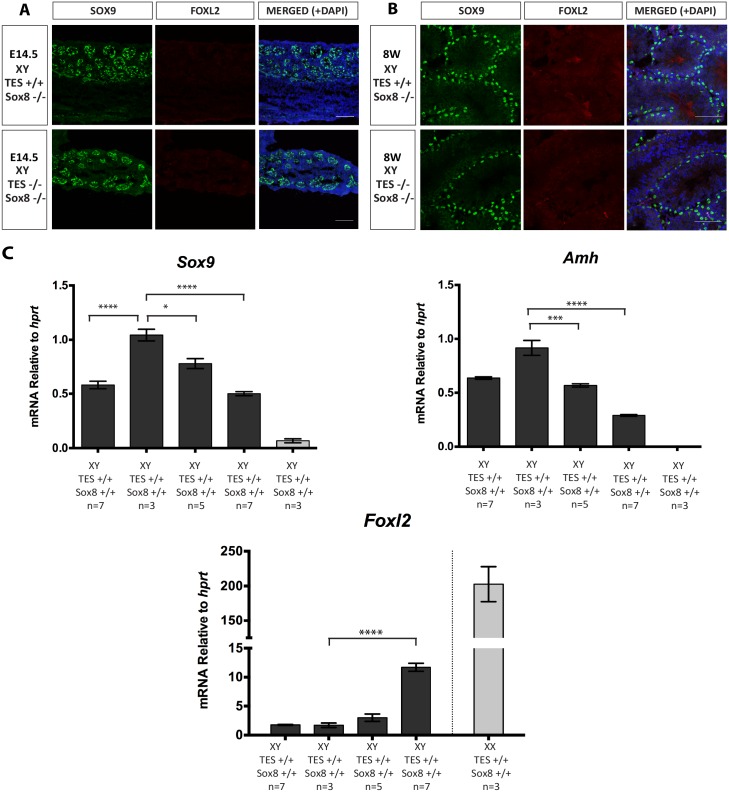
Fig 5. Immunofluorescence and real-time quantitative RT-PCR analysis of mice carrying TES deletion on Sox8-null background.
(A) Immunostaining of 14.5 dpc XY testis of wild type and TES-/- embryos on a Sox8-null background. (B) Immunostaining of 8 week-old XY testes of wild type and TES-/- mice on a Sox8-null background. Testes were stained for SOX9 (green), FOXL2 (red) and DAPI (blue). (C) Gene expression in XY TES deleted gonads with Sox8-null background at 14.5 dpc. Data are presented as mean 2-ΔΔCt values normalized to Hprt. Sample size represents number of individuals and is indicated below each genotype. Error bars show SEM of 2-ΔΔCt values. P value is presented above the relevant bars (unpaired, two-tailed t-test on 2-ΔΔCt values). Dark grey bars: XY; light grey bars: XX.

