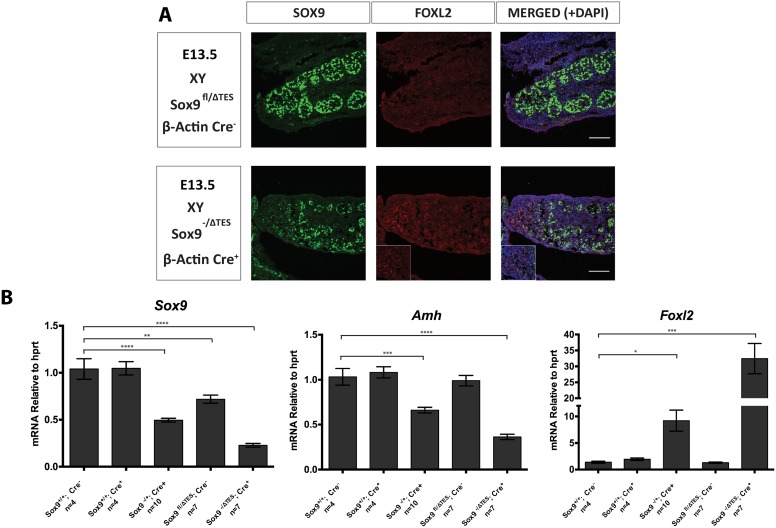
Fig 6. Comparison of Sox9fl/ΔTES and Sox9-/ΔTES gonads.
(A) Immunostaining of 13.5 dpc XY gonads of Sox9fl/ΔTES and Sox9-/ΔTES; β-Actin:Cre embryos. Gonads were stained for SOX9 (green), FOXL2 (red) and DAPI (blue). The pole of the gonad is indicated in the inset box. (B) Gene expression in XY gonads with or without conditional Sox9-null and TES deletions at 13.5 dpc. Data are presented as mean 2-ΔΔCt values normalized to Hprt. Sample size represents number of individuals and is indicated below each genotype. Error bars show SEM of 2-ΔΔCt values. P value is presented above the relevant bars (unpaired, two-tailed t-test on 2-ΔΔCt values).

