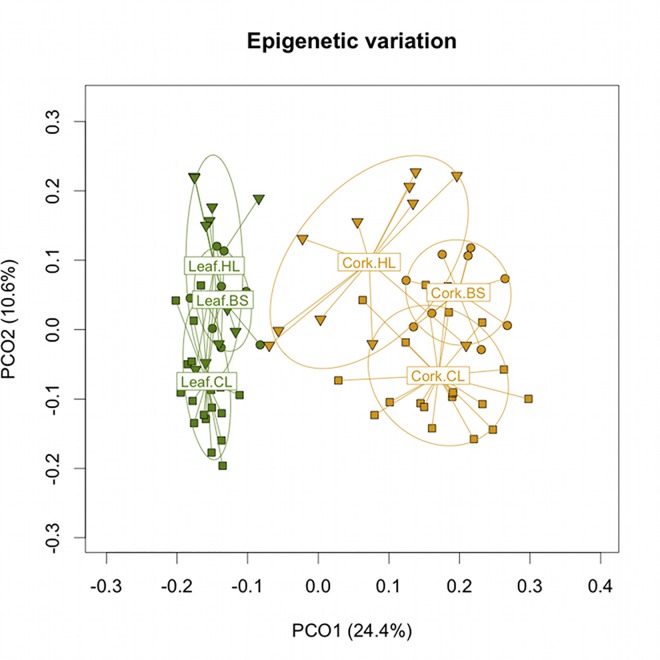
Fig 1. Principal Coordinate Analysis representing epigenetic differentiation between populations and tissues.
Graphical representation is based on the first two coordinates (PCO1 and PCO2) with the percentage of the variability shown between brackets. Inverted triangles represent trees from Herdade dos Leitões (HL), circles represent Barradas da Serra (BS) and squares represent Companhia das Lezírias (CL). The labels represent the centroid for the points cloud in each population and the ellipses represent the dispersion of those points around the centroid.

