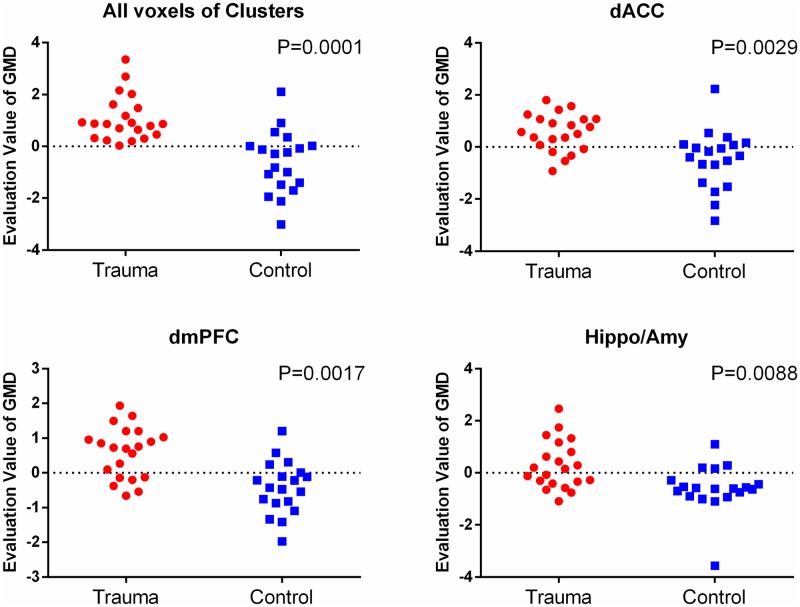
Fig 2. The classfication plot of individual diagnosis results.
A support vector machine was used to construct multivariate models and to classify participants as trauma survivors or controls. Evaluation value of GMD: the output value of the machine’s decision function for each test sample. The decision threshold is displayed by a horizontal line at the centre of the plot. Statistical significance P-values were generated by using permutation test (n = 10,000).

