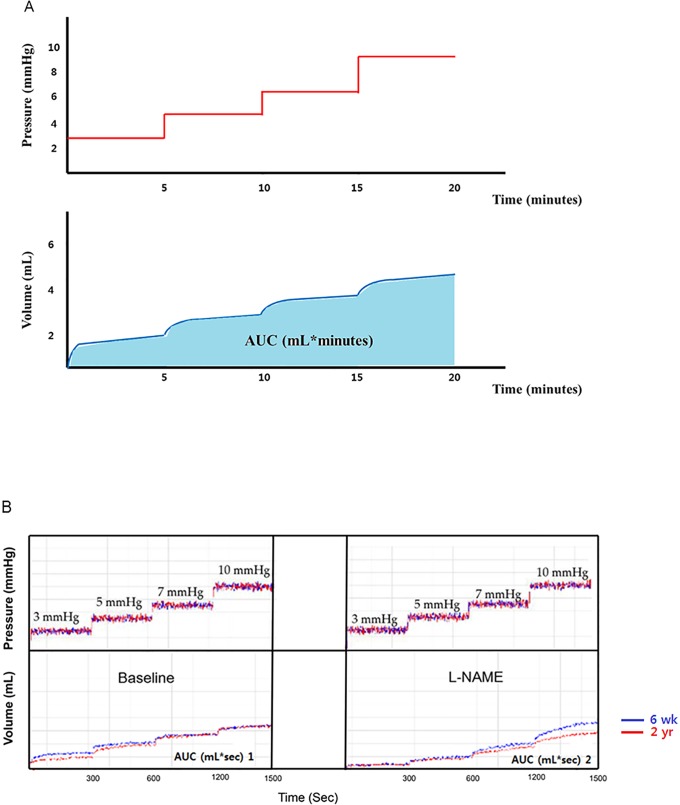
Fig 3. Measurement of the change in gastric accommodation.
(A) The pressure-dependent volume curve obtained by applying 3, 5, 7, and 10 mmHg at 5 minute intervals was measured in each aged rat group. The change of volume and area under curve (AUC) of the pressure-dependent volume was measured in each group to obtain the pressure-related volume (mL) * time (sec) in the tonic phase. (B) To analyze the gastric accommodation in each aged rat group, we compared with the pressure associated volume change and baseline AUC (mL*sec) of the aged rat groups. Afterwards, we compared the change in AUC (Δ AUC: AUC 2—AUC 1) after administering L-NAME to analyze the response of nNOS activity with age indirectly. The blue and red lines in the graph represent the pressure and volume curves of the 6-wk- and 2-yr-old rats. L-NAME, L-NG-nitroarginine methylester.

