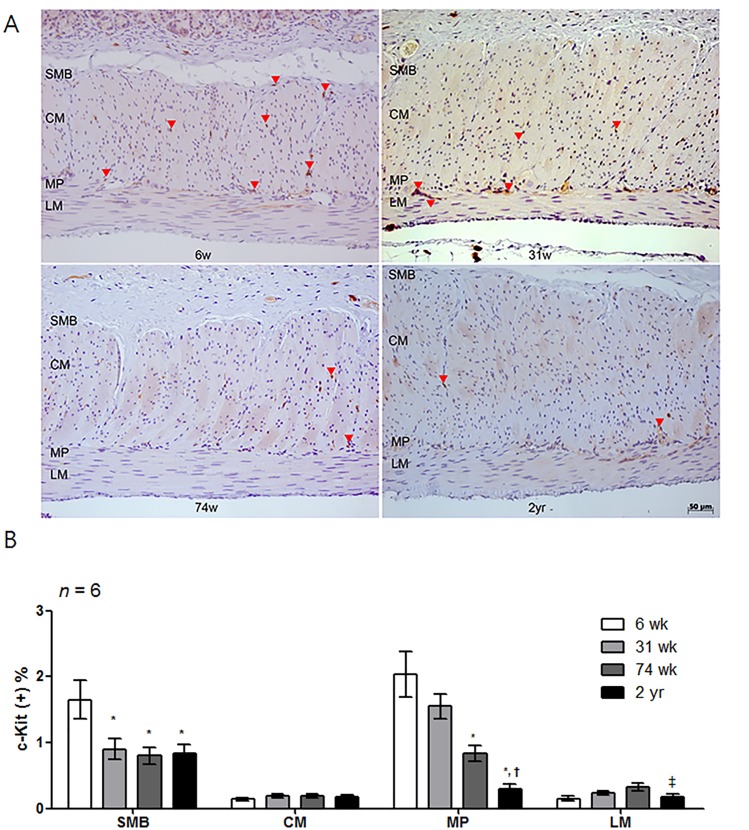
Fig 4. Analysis of c-Kit immunohistochemistry.
(A) Photomicrograph of c-Kit immunostaining of the proximal rat stomach. Arrows indicate the c-Kit immunoreactive cells (x200 magnification). (B) Comparison of the proportion of the c-Kit immunoreactive area of the SMB, MP, CM and LM in 6-, 31-, 74-wk- and 2-yr-old rats (n = 6 per group). The proportion of the c-Kit immunoreactive area tended to decrease with age. The result was expressed as the c-Kit positive percentage of the total area of each region. Each bar represents the mean ± SE. SMB, submucosal border; MP, myenteric plexus; CM, circular muscle; LM, longitudinal muscle.*P < 0.05 compared with 6-wk-old rats; †P < 0.05 compared with 31-wk-old rats; ‡P < 0.05 compared with 74-wk-old rats.

