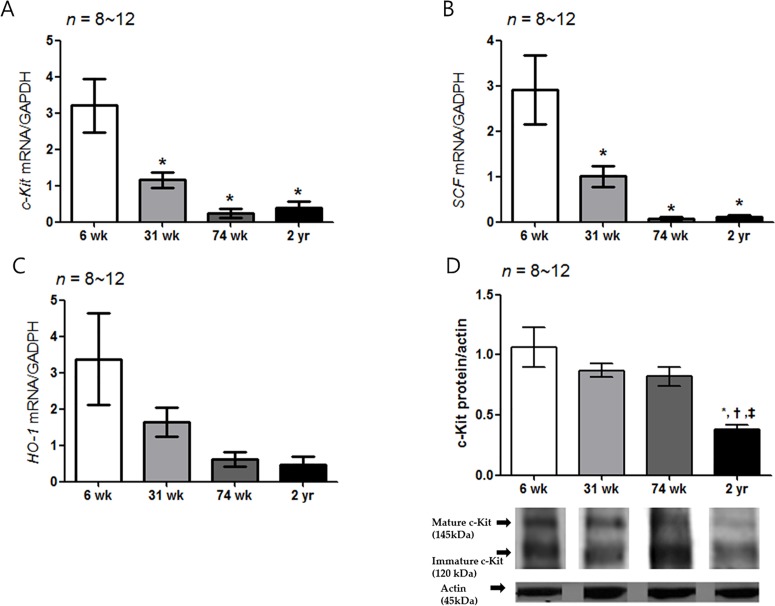
Fig 5. Expression of c-Kit, SCF, HO-1 mRNA and c-Kit protein.
(A) The expression of c-Kit mRNA by real-time PCR decreased with age. The c-Kit mRNA expression decreased significantly in the 31-, 74-wk-old and 2-yr-old rats compared with the 6-wk-old rats (P = 0.002 vs. 31-wk-old rats and P < 0.001 vs. 74-wk- and 2-yr-old rats): 6-wk-old rat group (n = 10), 31-wk-old rat group (n = 10), 74-wk-old rat group (n = 8) and 2-yr-old rat group (n = 12). (B) The SCF mRNA expression of other aged rat group was significantly lower than that of the 6-wk-old rat (P = 0.004 vs. 31-wk-old rats; P < 0.001 vs. 74-wk- and 2-yr-old rats) (n = 8–12). (C) No statistical difference was showed the HO-1 mRNA expression in different age rat group. (D) The c-Kit protein expression decreased with age. The c-Kit protein expression of 2-yr-old rats was lower than that of the other aged rat groups (P < 0.001 vs. 31-wk-old rats; P = 0.001 vs. 74-wk-old rats and P = 0.009 vs. 2-yr-old rats) (n = 8–12). The results are shown as the mean value of the optical density (OD). The optical densities corresponding to the mature (145 kDa) and immature (120 kDa) forms were combined in the analysis process using densitometry. Each bar represents the mean ± SE. *P < 0.05 compared with 6-wk-old rats. †P < 0.05 compared with 31-wk-old rats; ‡P < 0.05 compared with 74-wk-old rats.

