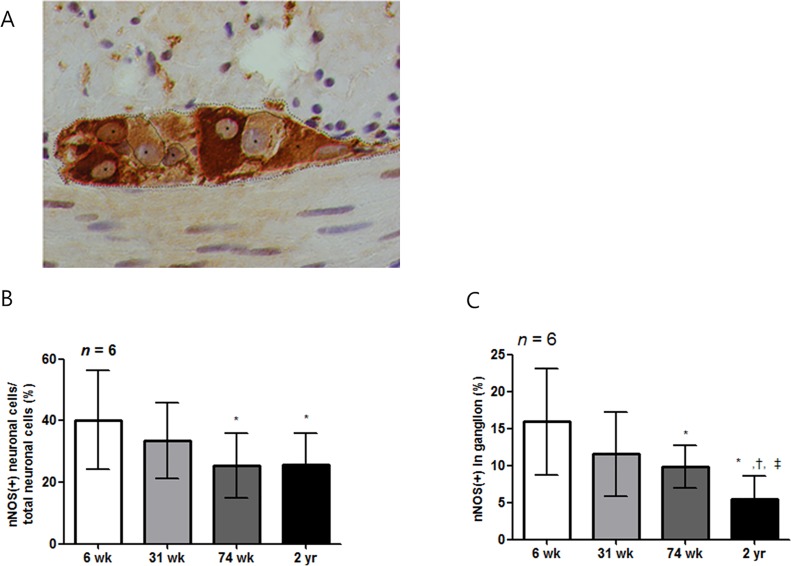
Fig 7. The enumeration of neuronal cell in myenteric ganglia.
(A) ganglia in the myenteric plexus were micro graphed at x1,000. We enumerated the nNOS-positive (indicated with red line) or -negative (indicated with black line) myenteric neurons, which include nucleus (indicated with asterisk), in the ganglion (contours of the ganglion are indicated by dashed lines). (B) The percent of nNOS positive neuronal cells of total neuronal cells in ganglion of 74-wk-old and 2-yr-old rats was significantly lower than that of 6- and 31-wk-old rats (P = 0.002, 6-wk- vs. 74-wk-old rats; P = 0.002, 6-wk- vs. 2-yr-old rats; P = 0.041, 31-wk- vs. 74-wk-old rats, and P = 0.019, 31-wk- vs 2-yr-old rats). (C) Mean of proportion of nNOS-immunoreactive area in ganglion was also decreased as age increased (P = 0.020, 6-wk- vs. 31-wk-old rats; P = 0.001, 6-wk- vs. 74-wk-old rats; P < 0.001, 6-wk- vs. 2-yr-old rats; P < 0.001, 31-wk- vs. 2-yr-old rats, and P < 0.001, 74-wk- vs 2-yr-old rats). Each bar represents the mean±SE. *P < 0.05 compared with 6 wk of age; †P < 0.05 compared with 31-wk of age; ‡ P < 0.05 compared with 74-wk-old rats.

