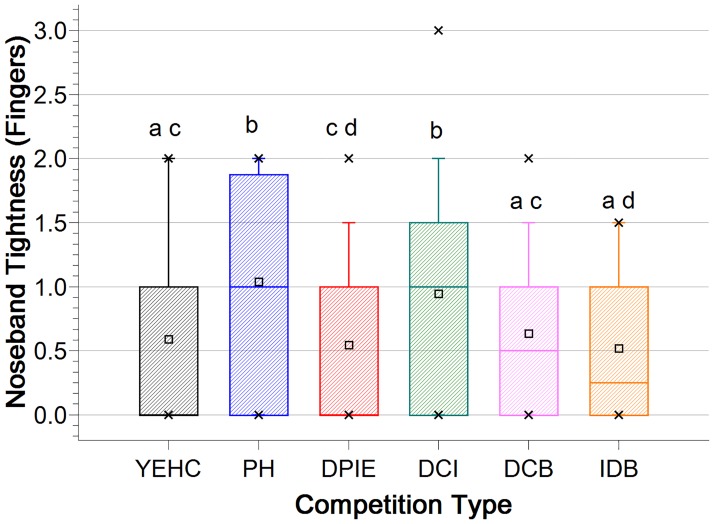
Fig 10. Median and inter-quartile range measures of noseband tightness level (Fingers) in 6 different competition types.
Tightness levels differ significantly except where they share the same superscript. Maximum and minimum values are indicated by ‘x’, with whiskers identifying the 5% and 95% values. The large rectangles represent 25–75% of values, with the median value indicated by the thick crossline, and mean values by the small square symbol.

