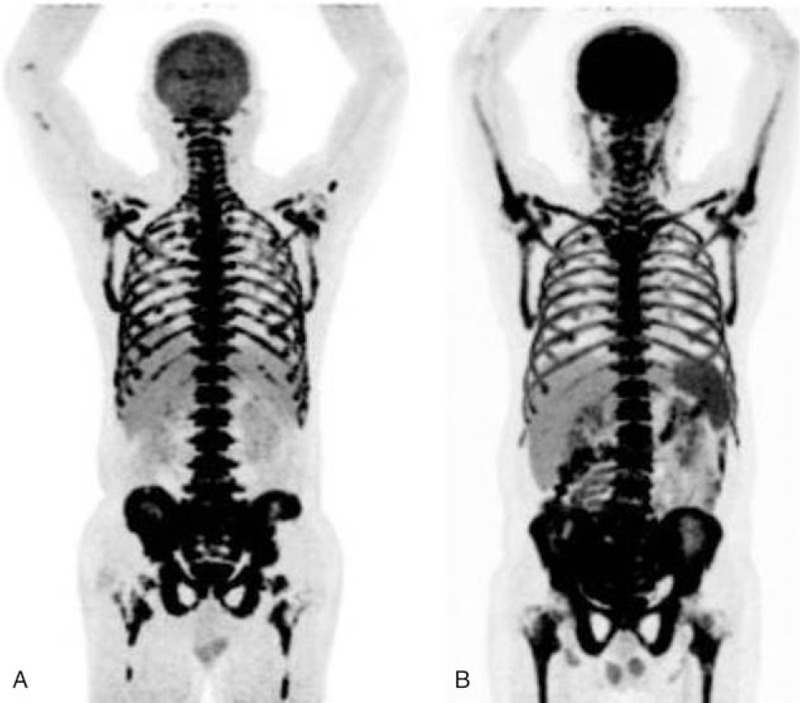
Figure 2.

The MIP images of patient with NK/T Lymphoma (A) and leukemia (B). A, 18F-FDG uptake in the BM was markedly increased, which was higher than that in the brain with SUVmax 11.05 and BM/C ratios 1.23. The patient also had the decrease in-the-blood hemogram (WBC, 1.10 × 10⁶; HB, 6.0 g/d; PLT, 19 × 106). B, 18F-FDG uptake in the BM was markedly increased, which was similar to the brain with SUVmax 10.0 and BM/C ratios 1.02. The peripheral WBC count was increased (140.6 × 10⁶), while the HB and PLT were decreased (HB, 13 1 g/dL; PLT, 114 × 106). 18F-FDG = fluorine-18 fluoro-D-glucose, BM = bone marrow, BM/C = bone marrow/cerebellum ratio, HB = hemoglobin, MIP = maximum intensity projection, PLT = platelate, SUVmax = maximum standardized uptake value, WBC = white blood cell.
