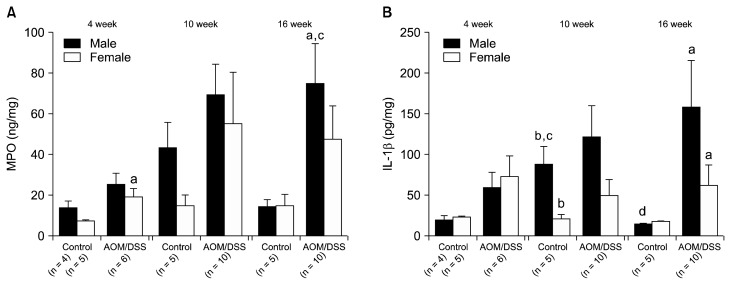
Figure 3.
The levels of (A) myeloperoxidase (MPO) and (B) interleukin (IL)-1β in colonic mucosa measured with ELISA. Data were described as mean ± SE. aP < 0.05 comparing control and azoxymethane/dextran sulfate sodium (AOM/DSS); bP < 0.05 comparing male and female; cP < 0.05 compared to week 4; dP < 0.05 comparing week 10 and 16.

