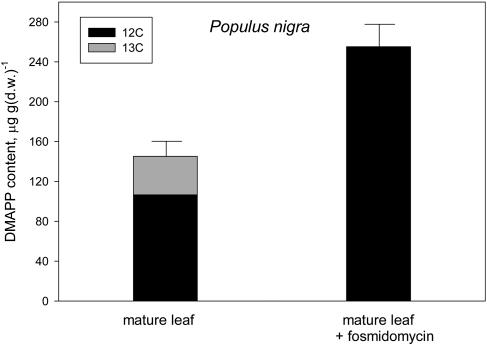
Figure 3.
12C (black) and 13C (gray) after a 15-min 13CO2 labeling in the DMAPP contained by mature leaves of P. nigra emitting isoprene (left bar) or after inhibiting isoprene emission by fosmidomycin feeding (right bar). Total DMAPP is shown as mean ± se (error bars) of n = 4 measurements. Labeled and unlabeled fractions of DMAPP are shown as mean values. se of these fractions was always <10% of the mean.

