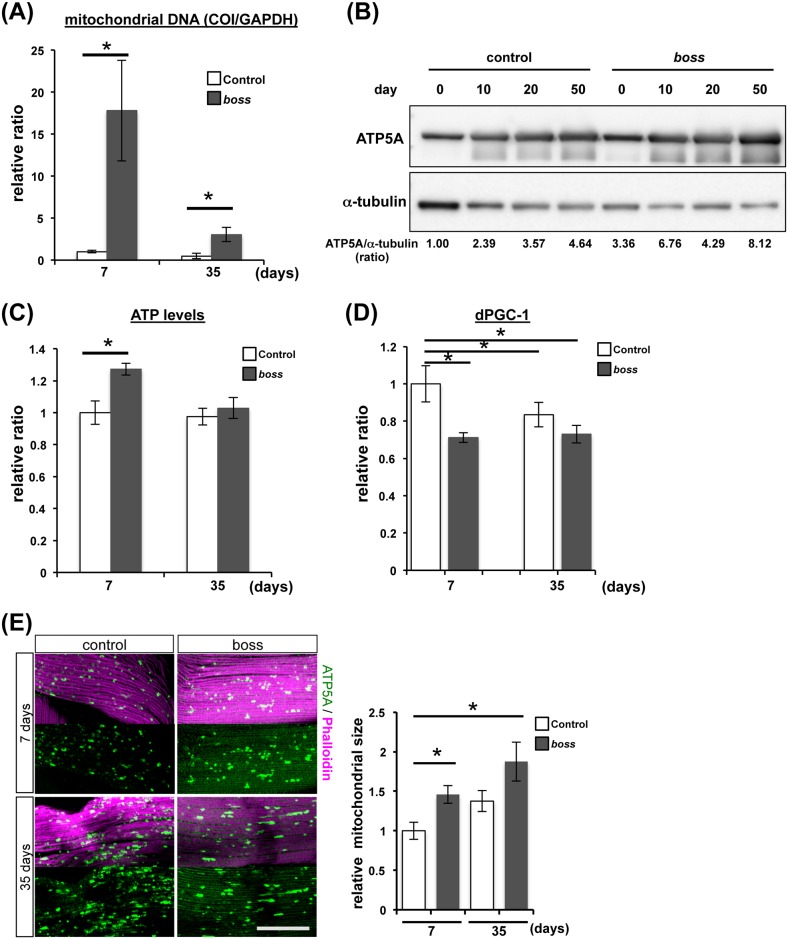
Fig 6. Mitochondrial mass is increased in boss mutant flies.
(A) Quantification of mitochondrial DNA (mtDNA) in control and boss mutant flies as determined by qPCR (n = 3, 5 flies per replicate). mtDNA of both young (7-days) and old (35-days) boss mutant flies was greater than in control flies. Data are means ± SEM (t-test, *P<0.05). (B) The amount of mitochondria was determined using Western blotting and anti-ATP5A antibody. ATP5 levels were increased in boss mutant flies, suggesting that the total mass of mitochondria increased. Values at bottom of columns are quantitation of ATP5A densitometry analysis (ATP5A/tubulin ratio). (C) ATP production levels were measured in young (7-days) and old (35-days) flies (n = 3, 5 flies per replicate). Data are means ± SEM (t-test, *P<0.05). (D) Expression of pgc1 mRNA was measured in young (7-days) and old (35 days) flies by qRT-PCR (n = 3, 10 flies per replicate). pgc-1 mRNA levels were significantly decreased in young boss mutant flies, indicating indicates mitochondrial biogenesis is reduced. Data are means ± SEM (t-test, *P<0.05). (E) Representative confocal images showing indirect flight muscles stained with phalloidin (magenta) and anti-ATP5 antibody (green). One representative optical section is shown from each phenotype. Scale bar, 50μm. Comparison of the mitochondrial size of both young (7-days) and old (35-days) of control and boss mutant flies are shown to the right. Data are means ± SEM (t-test, *P<0.05).

