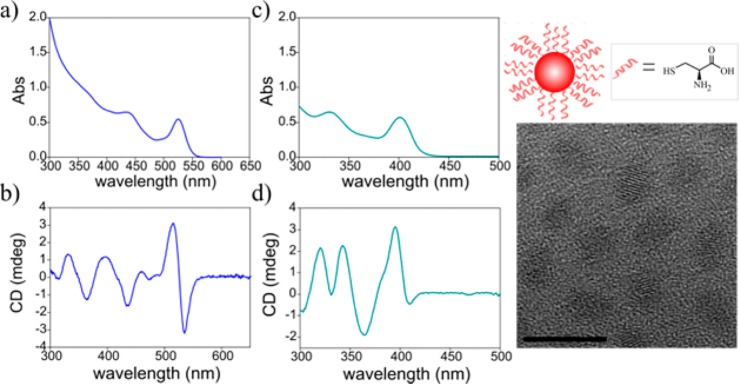
Figure 1.
(a,b) Absorption and CD spectra of CdSe QDs sample 1. (c,d) Absorption and CD spectra of CdS QDs. On the right-hand side a TEM image of the CdSe QDs. The scale bar is 10 nm. The prolate achiral shape is typical for all samples addressed in this work. The CD only originates from interactions with chiral cysteine molecules as depicted in the drawing above the TEM image.

