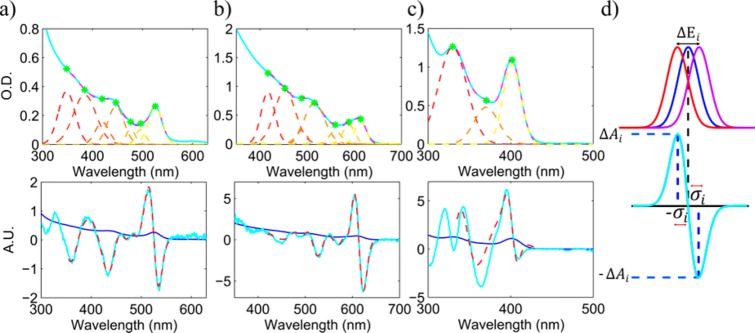
Figure 3.
Analysis of absorption and CD spectra. Top (a–c):
Absorption spectra of (a) CdSe sample S1, (b) CdSe sample S2, and
(c) CdS QDs. The measured spectra appear in cyan. The Gaussians that
reconstruct the spectra in dashed colored lines, where the green dots
mark their maxima. These peaks can be assigned to the different excitonic
transitions22 (from low to high energy):
1S3/21Se, 2S3/21Se, 1S1/21Se, 1P3/21Pe, 2S1/21Se, 1P5/21Pe or
1Pl1/21Pe (light hole subband), and
3S1/21Se. The dashed pink lines mark the reconstructed
absorption spectra. Bottom (a–c): Reconstructed CD spectra
for the same samples as in the top images, using the derivatives of
the Gaussians at the same center wavelengths. The blue line marks
again the measured absorption spectrum. The cyan lines mark the measured
CD and the dashed pink lines the CD spectrum that was reconstructed
using the sum of derivatives. (d) A scheme depicting the relevant
quantities to determine energy splitting (ΔEi) from the CD and absorption measurements.
The energy splitting is proportional to  .
.

