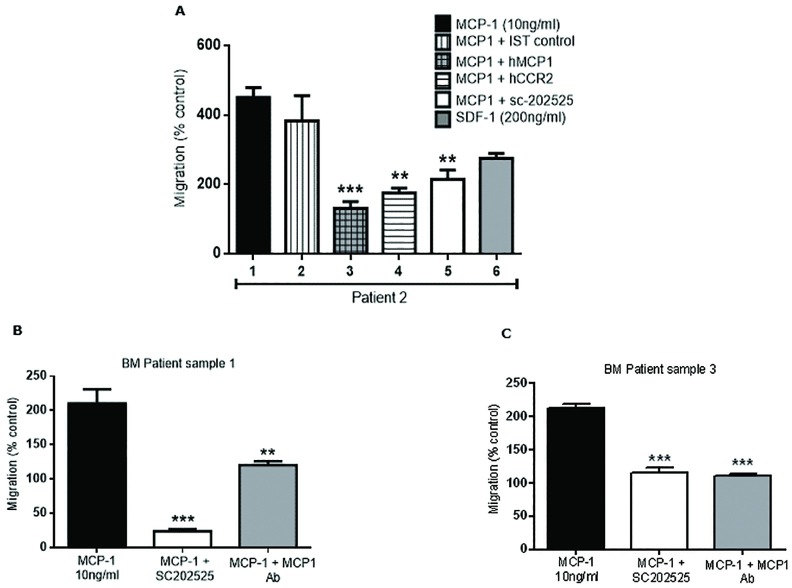
Fig 4. Cell migration analysis of primary AML cells in response to CCL2.
(A) Primary purified leukemia cells (Patient 2—Table 1) were seeded on the upper chamber of a transwell plate and incubated with CCL2 (10 ng/ml), isotype control antibody, anti-CCL2 (5 μg/ml), anti-CCR2 (10 μg/ml), sc-202525 (CCR2 inhibitor, 5 nM) or SDF-1 (200 ng/ml) (positive control) overnight to measure leukemia cell migration. Patient 1 (CCR2+, Table 1) (B) and Patient 3 (CCR2+, Table 1) (C) leukemia cell migration was also measured in response to CCL2, sc-202525 or anti-CCL2 incubation overnight. Primary leukemia cell migration for each study was measured by FCM. Each bar represents the mean ± SD of 3 independent experiments (**p < 0.01; ***p < 0.001).

