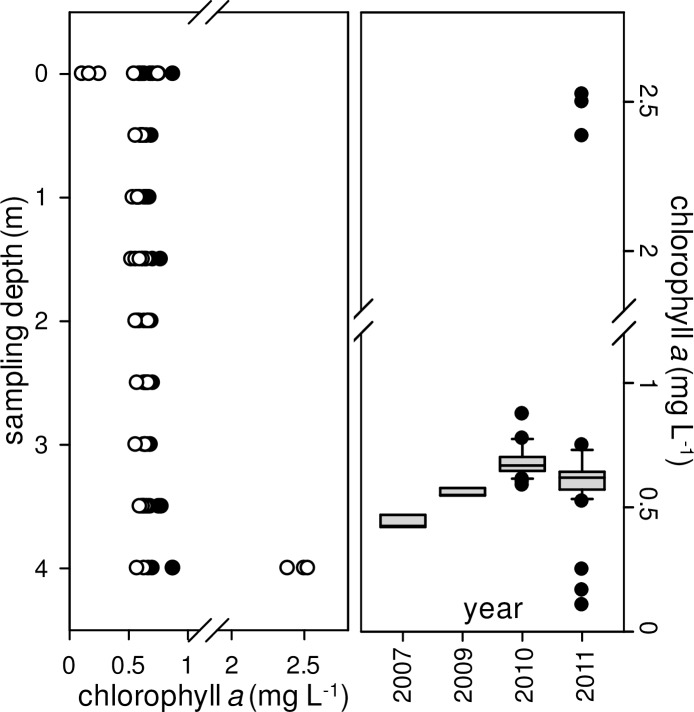
Fig 4. Chlorophyll a dynamics in the Dziani Dzaha during 2010 and 2011 surveys.
(A) Sum of all chl a measures depending on sampling depth for 2010 (closed circles, n = 27) and 2011 (open circles, n = 37) surveys. (B) Box-plot indicating median, 10th and 90th percentiles (whiskers) and outliers (closed circles) for chl a concentrations including single samples collected in 2007 (n = 3) and 2009 (n = 3), and 2010 (n = 33) and 2011 (n = 47) surveys.

