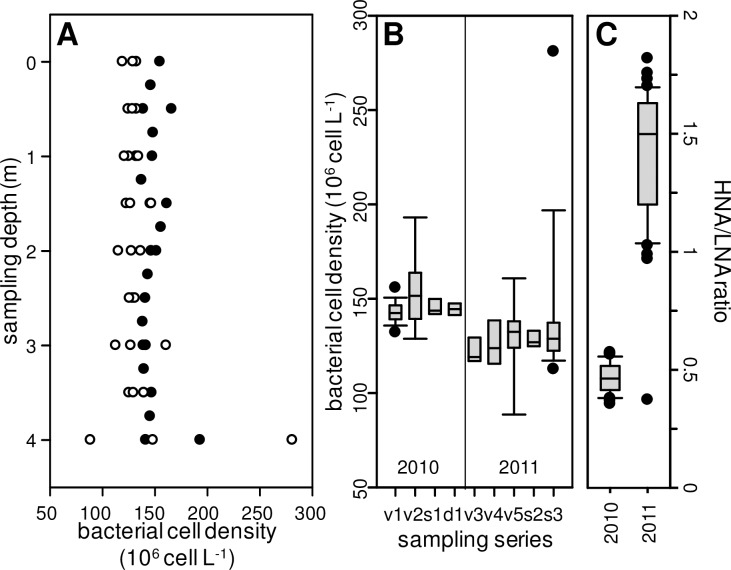
Fig 7. Bacterioplankton cell densities in the Dziani Dzaha.
(A) Vertical profiles from discrete samples collected during 2010 (closed symbols) and 2011 (open symbols) surveys. (B) Box-plot indicating median, 10th and 90th percentiles (whiskers) and outliers (closed circles) for bacterioplankton cell densities depending on sampling series: v = vertical profiles; s = surface spatial sampling; d = deep spatial sampling. (C) Box-plot (same attributes) of high- to low-DNA content bacteria ratio for 2010 and 2011 surveys.

