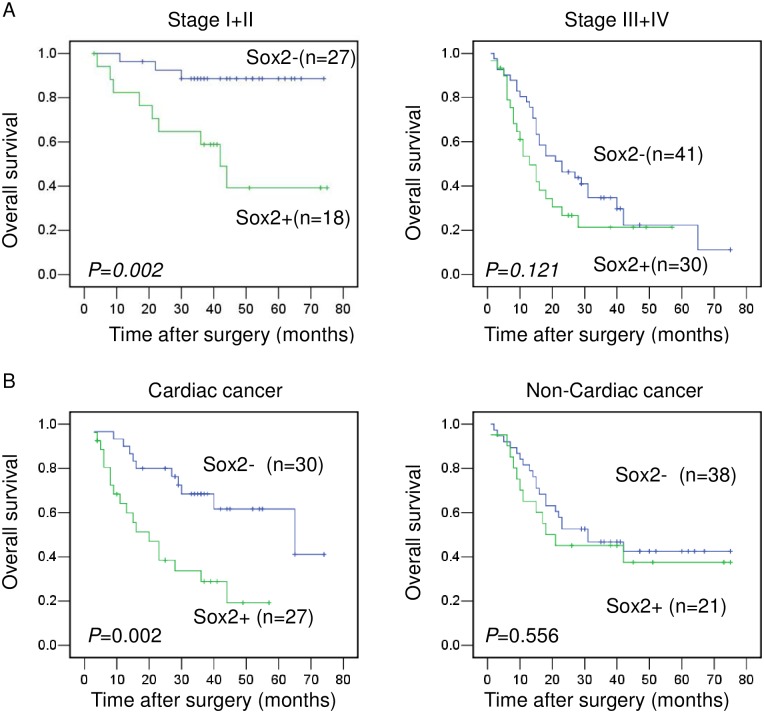
Fig 3. Kaplan-Meier survival curves of patients with different stages and tumor locations according to Sox2 expression.
(A) Overall survival of patients in the Stage I and II group and in the Stage III and IV group. (B) Overall survival of patients in the cardiac gastric cancer and in non-cardiac cancer groups.

