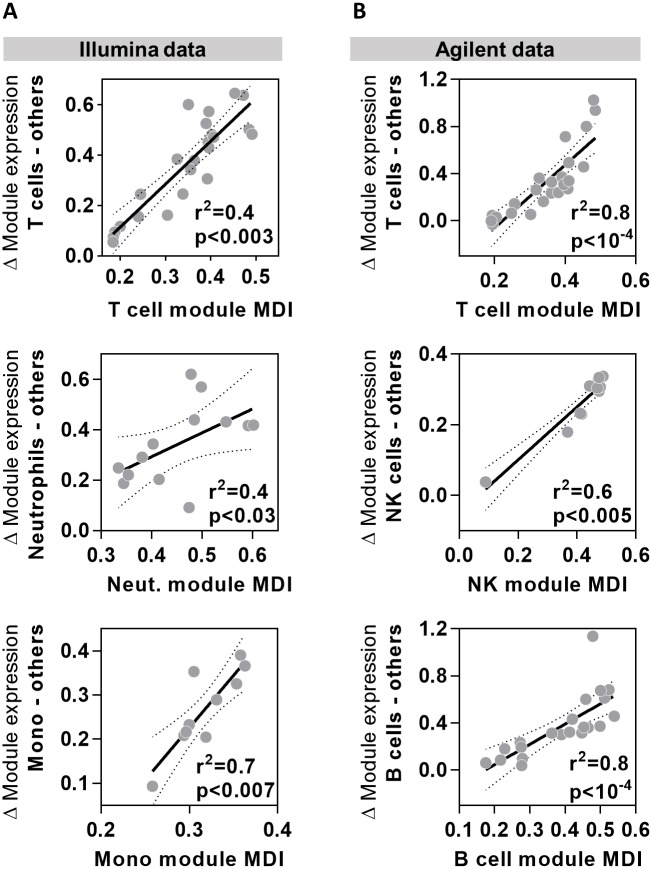
Fig 3. Cell type module MDI scores correlate closely with difference in gene expression between target and non-target cells.
Relationship between the module MDI and relative difference in geometric mean expression of selected cell-type specific modules in data from target cell types compared to all other cell types derived from (A) Illumina (E-GEOD-19443) and (B) Agilent microarray (E-GEOD-6887) data. Data points represent data derived from individual modules, giving regression lines with 95% confidence limits, Spearman rank correlation coefficients (r2) and p values.

