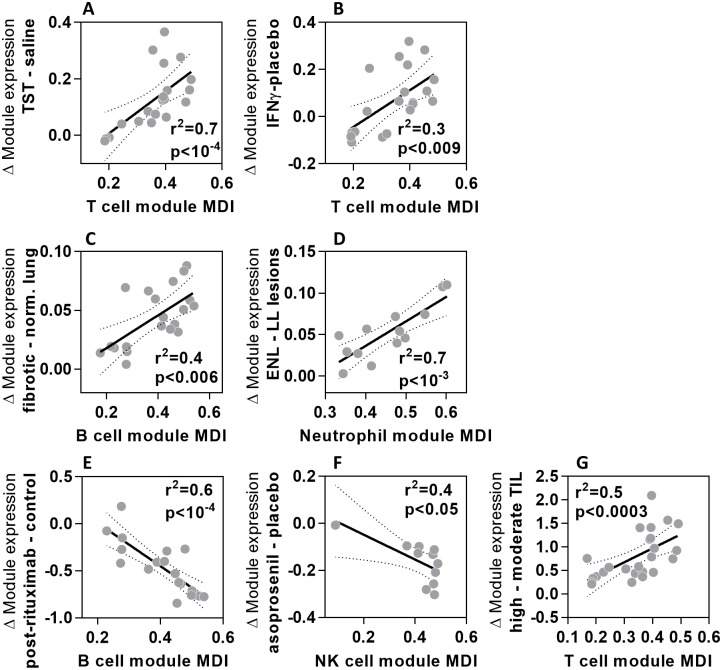
Fig 4. MDI scores identify modules that best reflect changes in cell number in tissues.
Relationship between the module MDI and relative difference in geometric mean expression of cell-type specific modules for (A) T cells at the site of TST compared to saline injections; (B) T cells in psoriatic skin injected with IFNγ compared to saline; (C) B cells in pulmonary fibrosis tissue compared to normal lung; (D) neutrophils in erythema nodosum leprosum (ENL) skin lesions compared to lepromatous leprosy (LL) skin lesions; (E) B cells in blood samples from patients before and after receiving rituximab therapy; (F) NK cells in the uteri of women treated with 25mg asoprisinil compared to placebo; (G) T cells in head and neck tumours with high compared to moderate levels of tumour infiltrating lymphocytes (TIL). Data points represent data derived from individual modules, giving regression lines with 95% confidence limits, Spearman rank correlation coefficients (r2) and p values.

