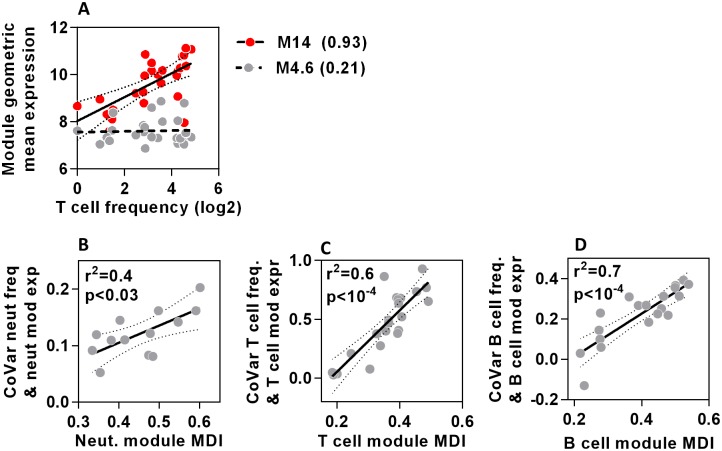
Fig 5. MDI scores predict strength of covariance between module gene expression and cell frequency in blood.
(A) Relationship between geometric mean expression of two T cell modules which show highest (M14) and lowest (M4.6) covariance (shown in brackets) with T cell frequency in peripheral blood. Each data point represents measurements derived from a TST in separate individuals. Regression lines and 95% confidence limits are shown for each module. (B-D) The relationship between covariance of neutrophil, T cell or B cell frequencies and cell-type specific module expression, with the MDI for each module. Data points represent data derived from individual modules, giving regression lines with 95% confidence limits, Spearman rank correlation coefficients (r2) and p values.

