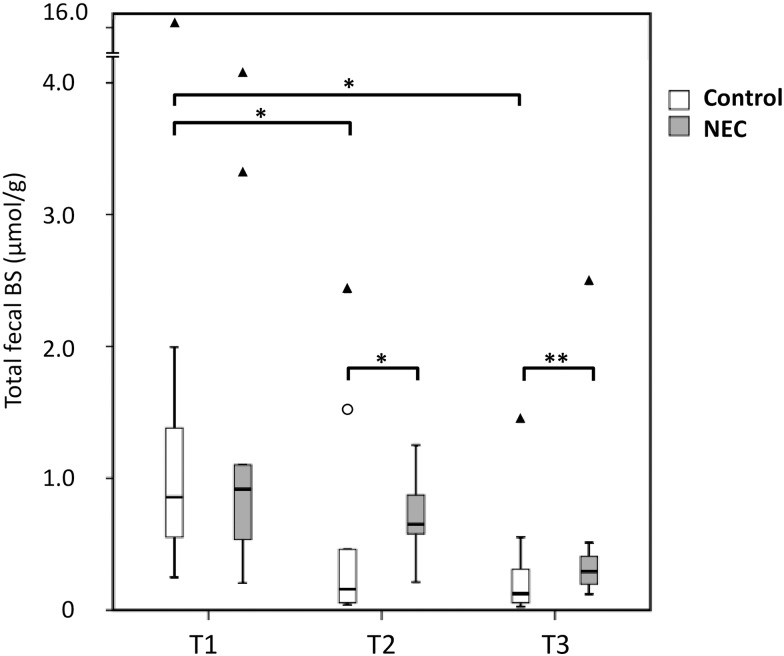
Fig 1. Box plot of total BS concentrations.
The median is marked by the horizontal line in the central box. The boxes are limited by the 25th and 75th percentiles. The whiskers (┴) represent the lowest and highest total BS within 1.5 interquartile distance below or above the box. Outliers (○) represent BS concentrations between 1.5 and 3 interquartile distances below or above the box. Extremes (▲) represent BS concentrations more than 3 interquartile distances above the box. Feces was collected at three different points in time; within three days after birth (T1), five to six days prior to NEC (T2), zero to two days prior to NEC (T3). Total BS concentration: sum of all individual BS concentrations, irrespective of the conjugation status, detected with gas chromatography and expressed in μmol/g dry weight feces.*: p < 0.05, **: p < 0.1 (T3: p = 0.07).

