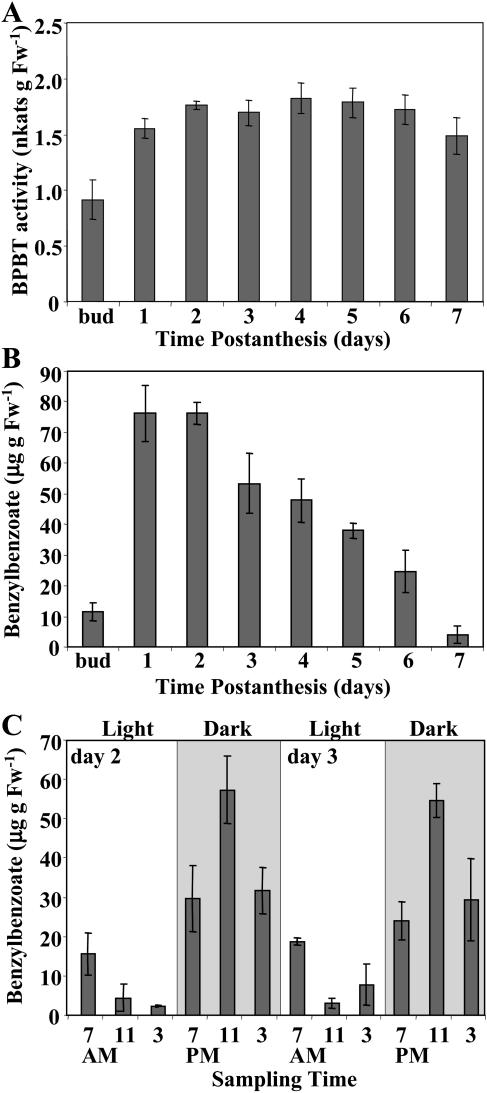
Figure 10.
Characterization of the BPBT activity (A) and internal pools of benzylbenzoate during flower development (B) and two daily light/dark cycles (C) in petunia petals. Each graph represents the average of three independent experiments. sds are indicated by vertical bars. Gray and white areas in C correspond to dark and light, respectively.

