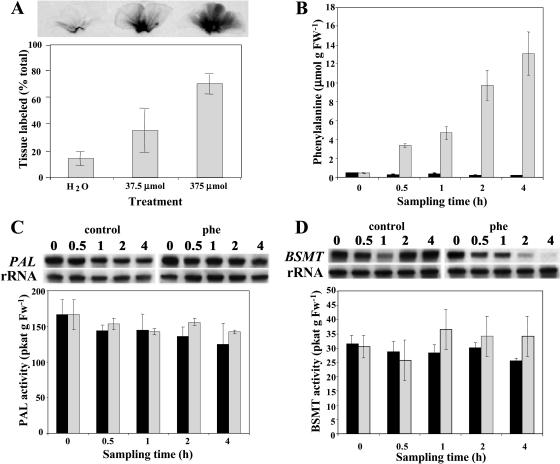
Figure 3.
Effect of Phe feeding on its distribution throughout petal tissue (A), endogenous Phe pool (B), PAL (C), and BSMT (D) mRNA gene expression and enzyme activities. Black and gray bars represent control (nonfed) and Phe-fed petunia flowers, respectively. A, [14C]Phe along with shown concentrations of unlabeled Phe was fed to petunia petals for 1 h. The top autoradiography shows label movement, and quantification of this movement is shown in the graph below. B, Quantification of endogenous Phe pool under experimental conditions. Graph represents the average of three independent experiments. sds are indicated by vertical bars. C and D, RNA blot analysis of PAL and BSMT mRNA levels (top) and PAL and BSMT activities (bottom graphs) in control and Phe-fed petal tissues at time points of sampling used in feeding experiments. Autoradiography of RNA blots was performed overnight. The blots were rehybridized with an 18S rDNA probe (bottom of top) to standardize samples. Each blot represents a typical result of three independent experiments, including the ones shown here. Enzyme assays were run in duplicate for each time point on at least five independent crude extract preparations for both PAL and BSMT activities, and the sds indicated by vertical bars were obtained.

