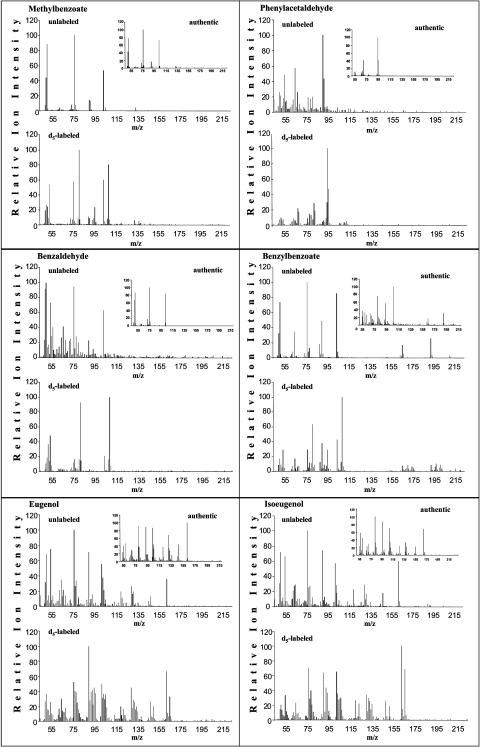
Figure 4.
GC-MS analysis of benzenoid and phenylpropanoid compounds produced by petunia petal tissue fed with Phe and 2H5-Phe for 4 h. The panel for each presented compound contains mass spectrum of authentic compound standard, mass spectrum of compound extracted from Phe-fed tissue (unlabeled), and mass spectrum representing a combination of unlabeled and labeled compound extracted from 2H5-Phe fed petal tissue (d5-labeled). All newly synthesized labeled benzenoid compounds exhibit a mass shift by 5 amu, except eugenol and isoeugenol, which exhibit a shift of only by 3 amu.

