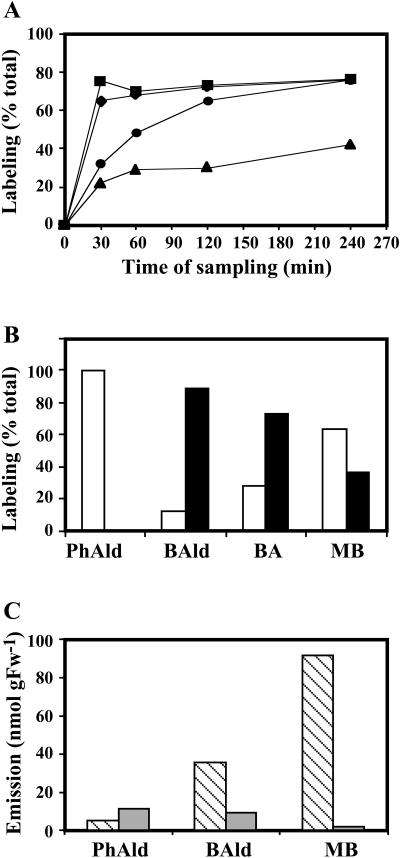
Figure 5.
Identification of relationships between compounds within benzenoid network in petunia. A, In vivo labeling kinetics of benzenoid/phenylpropanoid compounds after feeding petal tissue with 2H5-Phe. Squares represent percent of labeled phenylacetaldehyde; diamonds, benzaldehyde; circles, benzoic acid; and triangles, methylbenzoate. Each point represents an average of results from at least three independent experiments. B, In vivo labeling kinetics of benzenoid/phenylpropanoid compounds after feeding petal tissue with 2H5-benzaldehyde. Black and white bars show percent of labeled and unlabeled compounds, respectively, together representing the entire (100%) pool. C, Effect of AIP, an inhibitor of PAL activity, on emission of benzenoid/phenylpropanoid compounds. Hatched and gray bars represent emission from petal tissue pretreated for 40 min with water and AIP, respectively, prior to supplying Phe for 4 h with simultaneous scent collection.

