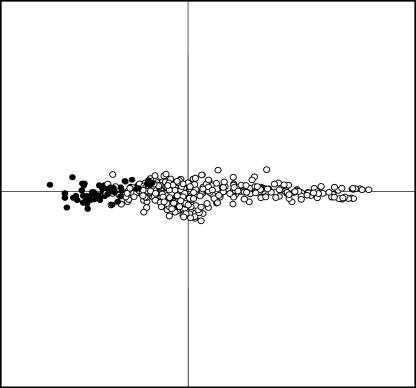
Figure 1.
Score plot (85% of dynamics) of the overall difference in transcriptional behavior of clones printed on the chip after subtraction of average of columns and rows for the PCA. Data points are from SSH−- (black circles) and SSH+- (white circles) cDNA libraries. The more separated two plotted cDNA clones are, the more diverged is their gene expression profile.

