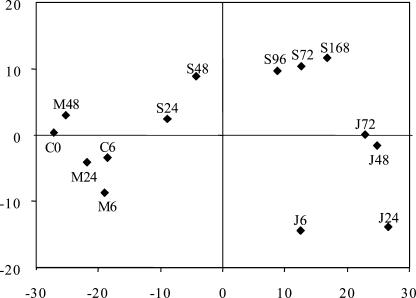
Figure 3.
Loading plot based on the overall gene expression in each of the different treatments. The transcriptional profile for each of the different treatments (columns) as two components explains 77% of the gene expression dynamics (PCA subtracting the average of columns and rows). The larger the distance between two sample-points the more diverged are the overall gene expression profiles for these treatments. Control (C), mechanically wounded (M), jasmonic acid sprayed (J), and spider mite infested (S). The number after each letter indicates hours after start of treatment.

