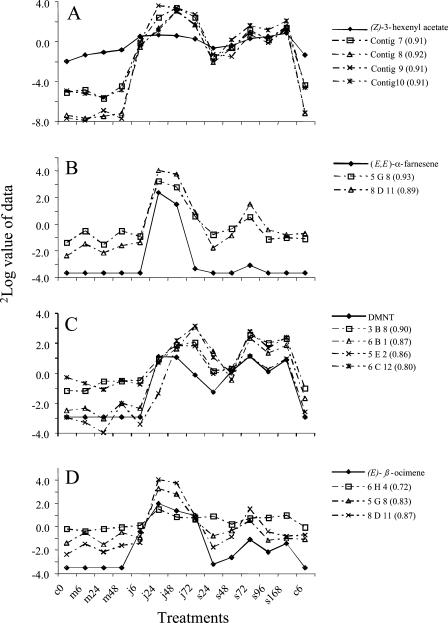
Figure 5.
Logarithmic values for collected volatile emission data and cDNA expression data at the different treatments are plotted in the same diagram. (Z)-3-hexenyl acetate and lipoxygenase derived contigs 7, 8, 9, and 10 described in Table I (P ≤ 0.001; A). (E,E)-α-farnesene and cDNA fragments (5G8 and 8D11) from the cloned (E,E)-α-farnesene synthase gene (P ≤ 0.001; B). Dimethyl-1,3(E),7-nonatriene (DMNT) plotted with four peroxidase-like cDNA fragments putatively involved in their biosynthesis (P ≤ 0.001; C). (E)-β-ocimene together with 1-deoxy-d-xylulose 5-phosphate reductase-like cDNA fragment (6H4) (P ≤ 0.005) and the farnesene synthase cDNA fragments (P ≤ 0.001; D). Pearson correlation coefficient for the association of cDNA fragment to the volatile in that diagram is in brackets.

