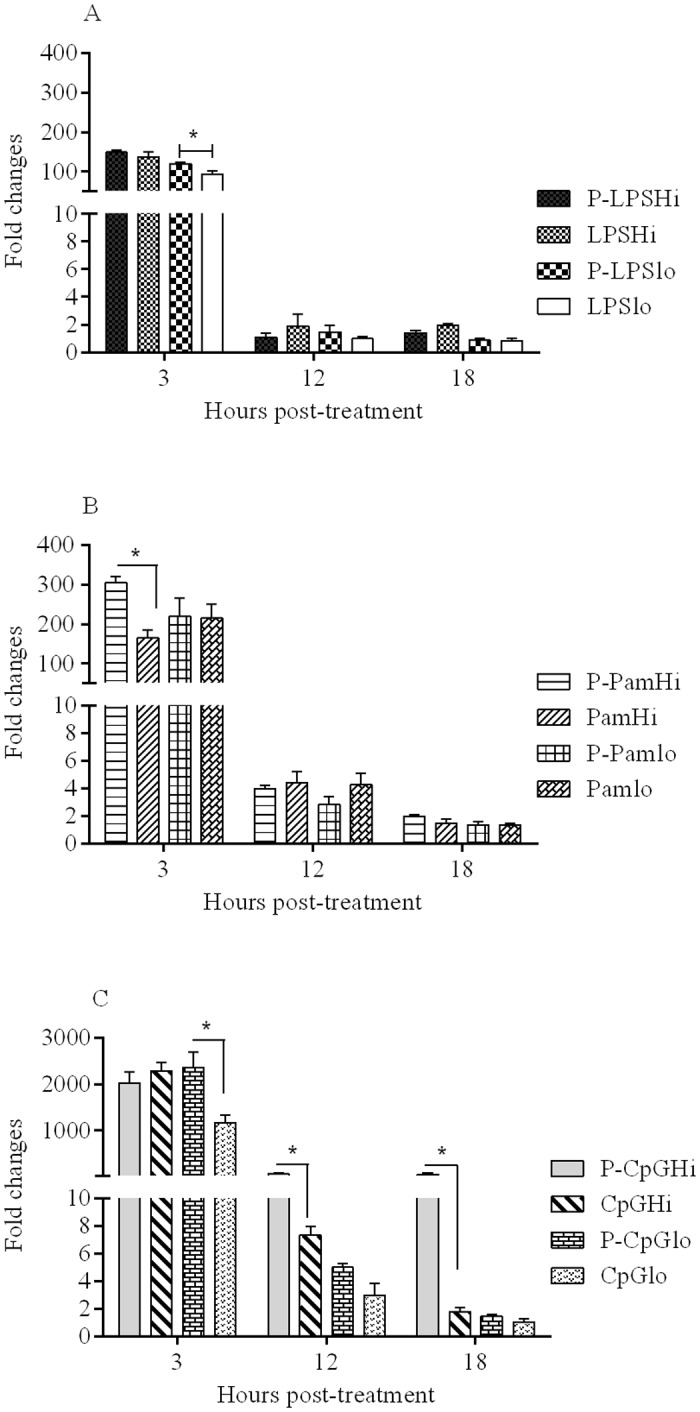
Fig 2. Expression profiles of IFN-γ for (A). LPS; (B). Pam3CSK4, and (C). CpG ODN.

Chicken macrophages (six replicates/group) were treated with encapsulated and soluble forms of the three TLR ligands and mean fold expression of IFN-γ in treated groups were compared to the cell culture medium treated group. Significance (P <0.05) was tested between delivery systems (encapsulated and soluble TLR ligands) within a dose and at a given time point. * indicates significant difference.
