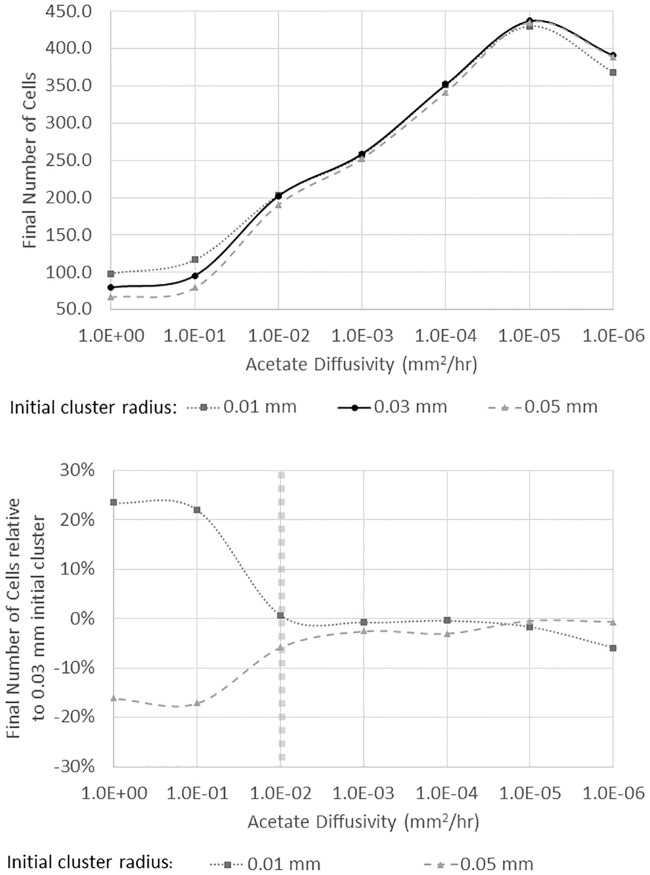
Fig 3. Final number of cells from an initial cluster of 16 scavenger cells for three different initial cluster sizes with different acetate diffusivity values (upper panel).
The lower panel shows the same information but the final cell population is shown as a percentage of the medium density initial cluster that had 16 cells in a circle with a radius of 0.03 mm. The vertical, dashed line marks the critical transition between a higher initial density resulting in greater growth to a regime where total growth is largely independent of initial density. The results shown represent the average of 8 simulations, and error bars are not visible as they same size as the symbols).

