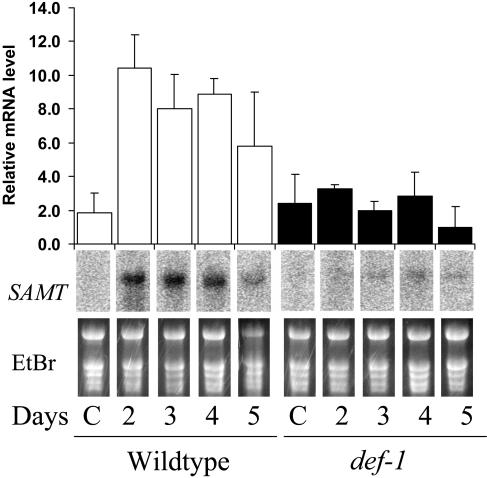
Figure 6.
Spider mite-induced expression of SAMT in def-1 and wild type. RNA gel-blot analysis of the gene encoding SAMT during spider mite infestation. For all plants the control for day 2 (C) is shown, which is representative for all other days of the control plants. Ethidium bromide-stained gels are shown to indicate equal loading. The bar graph represents quantification (means and SEs of duplicated experiments) of the hybridizing bands.

