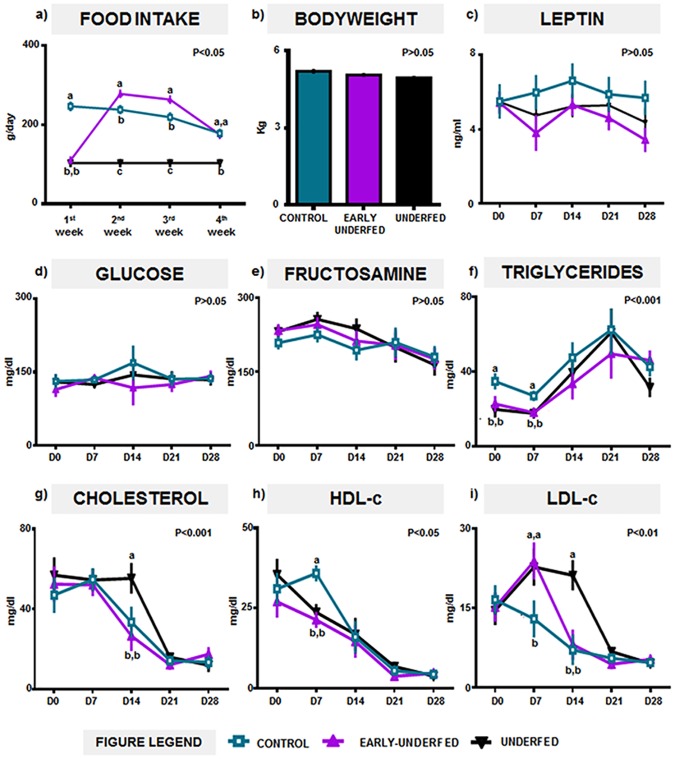
Fig 2. Effects of MFR on maternal food intake, bodyweight and plasma leptin, glucidic and lipid concentrations during pregnancy.
Number of pregnant dams per group employed for Fig. a) and b): CONTROL = 9, EARLY-UNDERFED = 11, UNDERFED = 12; Number of pregnant dams per group employed for Fig. c) to i): CONTROL = 5, EARLY-UNDERFED = 5, UNDERFED = 5. Statistical analyses were performed by ANOVA. Data presented as mean±SEM. Different superscripts indicate significant differences between groups (P<0.05).

