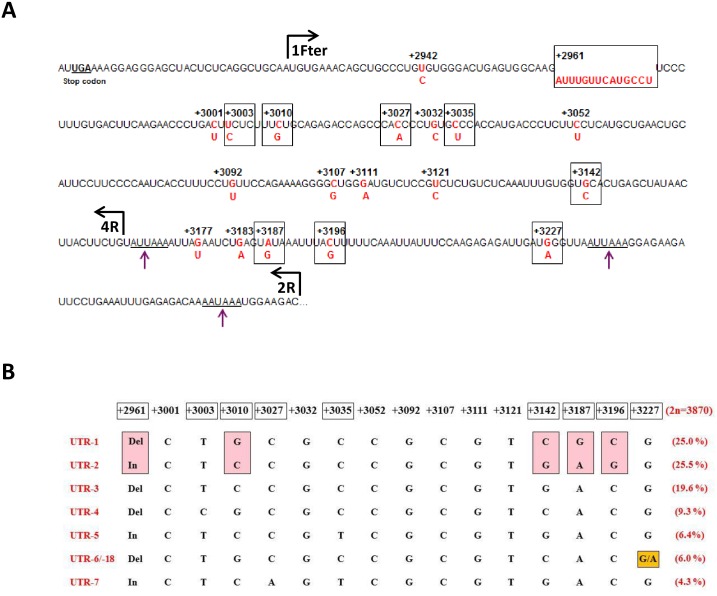
Fig 1. HLA-G 3’UTR polymorphisms.
(A) Variations in HLA-G mRNA (red) along the 3’UTR. The less frequent variants are positioned below the most frequent one in the nucleotide sequence. Polymorphic sites are framed in bold when the frequency of the minor allele worldwide is higher than 1%. Purple single arrows point to the three predicted polyadenylation signals. Vertical lines with horizontal arrows indicate the 5’ end of the HLA-G nucleotide sequences for 1Fter, 2R and 4R primers used in pMIR-REPORT™ constructions. (B) Sequence comparison of the most frequent 3’UTR haplotypes (21 worldwide populations; 2n = 3870) [25] analyzed in the present study. Frequencies are indicated on the right part. UTR-1 and UTR-2 differ at 5 positions (pink rectangles). UTR-6 and UTR-18 (analyzed in the present work) only differ at one position and depending on the UTR typing strategy that was used (i.e., targeting or not +3227 SNP), UTR-18 could be confused with UTR-6 in several studies.

