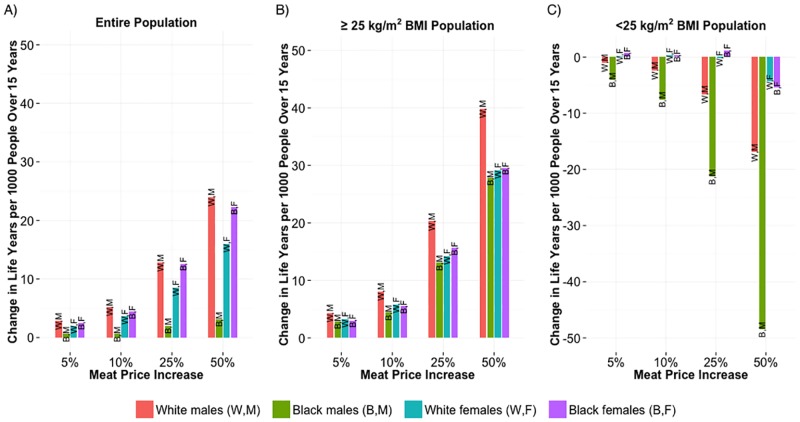
Fig 4. Difference in Life Years Lived Over 15 Years Relative to Status Quo.
(A) Difference in life years lived over 15 years per 1000 people under specified meat price increase, relative to that under no price change. (B) Same as A, including only individuals with initial BMI greater than or equal to 25 kg/m2. (C) Same as A, including only individuals with initial BMI less than 25 kg/m2.

