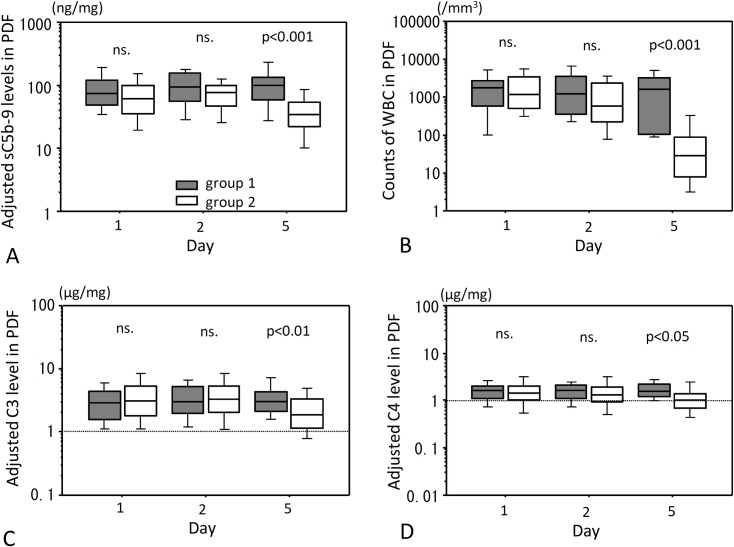
Fig 2. PDF levels of adjusted sC5b-9, C3 and C4 and WBC counts after onset of peritonitis.
PDF levels of sC5b-9, C3 and C4 adjusted for total protein on Days 1, 2 and 5 after onset of peritonitis are shown in (A), (C) and (D), respectively. Counts of WBC in PDFs are shown in (B). Gray hatched bar is group 1 and open hatched bar is group 2. ns., not significant. Statistical tests with Mann-Whitney U test and Bonferroni correction.

