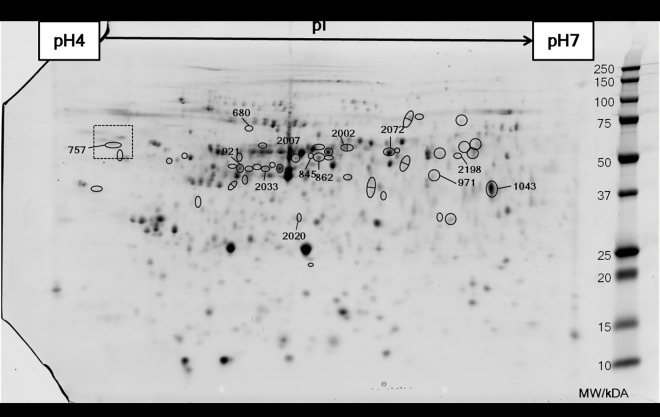
Fig 1. Representative gel of a two-dimensional SDS-PAGE of the epidermal mucus of Atlantic salmon.
The first dimension was run on a pH4-7 IPG strip and the second dimension was run on an Anykd Criterion gel. Molecular weights in kDa are denoted on the right side of the image as indicated by Precision Plus Dual Color protein standards (Bio-Rad). The circled spots represent those that show significant differential expression between dietary treatments as given by SameSpots analysis (n = 6, p<0.05). The spots that are circled and numbered refer to those that were subsequently identified by LC-MS/MS. The boxed area refers to Fig 2 where this part of the image has been magnified.

