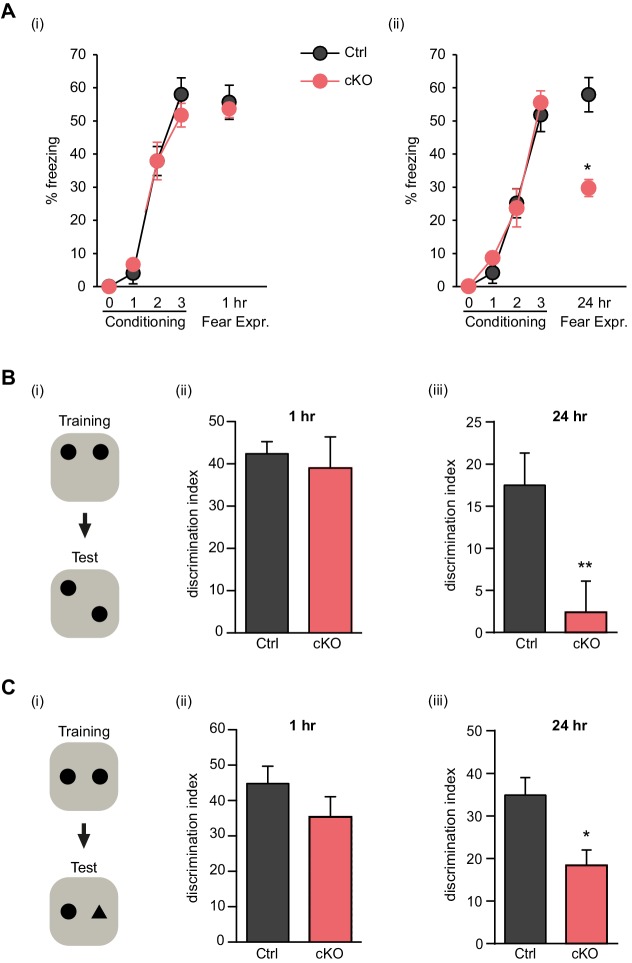
Figure 2. Satb2 is required for long-term memory formation.
(A) In a contextual fear conditioning paradigm, Satb2 cKO mice (cKO), showed (i) similar levels of freezing to Satb2flox/flox mice (Ctrl) during the fear-acquisition phase (cKO, n = 7; Ctrl, n = 6; repeated measures ANOVA, F3,33 = 0.76, p = 0.52) and at the 1 hr fear expression test (Student's t test, t11 = 0.19, p = 0.86) but (ii) froze significantly less than their littermate controls at the 24 hr fear expression test (cKO, n = 8; Ctrl, n = 8; repeated measures ANOVA, F3,42 = 0.36, p = 0.778; Student's t test, t14 = 4.88, p = 0.0002). Data are presented as mean ± SEM, n values refer to the number of mice per group, *p < 0.05. (B) Object location memory test. (i) Scheme of the experiment. (ii) Satb2 cKO mice (n = 11) and control mice (n = 10) exhibited similar preference for the novel location over the familiar location at the 1 hr memory retention test (Student's t test, t19 = 0.46, p = 0.65). (iii) Satb2 cKO mice (n = 8) showed reduced preference for the novel location over the familiar location at the 24 hr memory retention test (Student's t test, t14 = 2.89, p = 0.011) compared to Satb2flox/flox mice (n = 8). The relative exploration time is expressed as a percent discrimination index (D.I. = (tnovel location − tfamiliar location) / (tnovel location + tfamiliar location) × 100%). Data are presented as mean ± SEM, n values refer to the number of mice, **p < 0.01. (C) Novel object recognition test. (i) Scheme of the experiment. (ii) Satb2 cKO mice (n = 10) and control mice (n = 9) exhibited a similar preference for the novel over the familiar object at the 1 hr memory retention test (Student's t test, t19 = 1.11, p = 0.28). (iii) Satb2 cKO mice (n = 8) spent less time exploring the novel object at the 24 hr memory retention test (Student's t test, t14 = 3.0, p = 0.009) compared to Satb2flox/flox mice (n = 8). The relative exploration time is expressed as a percent discrimination index (D.I. = (tnovel object− tfamiliar object) / (tnovel object+ tfamiliar object) × 100%). Data are presented as mean ± SEM, n values refer to the number of mice, *p < 0.05.
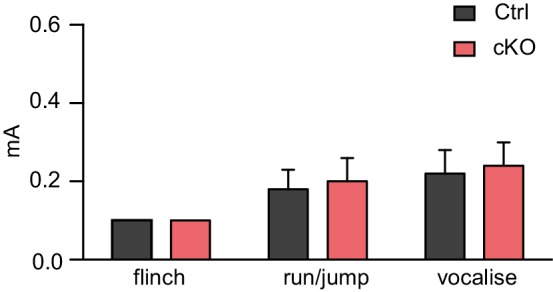
Figure 2—figure supplement 1. Satb2 cKO mice show normal responses to electric foot shock.


