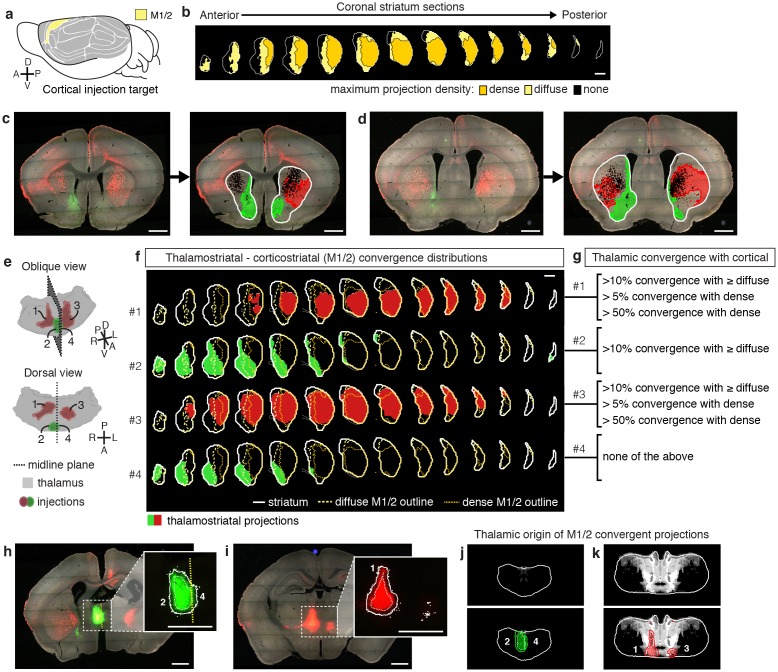
Figure 3. Localization of the origins of thalamostriatal projections that converge with a corticostriatal projection in the striatum.
(a) Schematic sagittal view of the mouse brain, adapted from (Watson et al., 2012), indicating the location of M1/2. (b) Distribution of dense (dark yellow) and diffuse (light yellow) corticostriatal projections from M1/2. (c–d) Representative images of two coronal sections through the striatum of one example brain (left panels in c and d) showing the fluorescent thalamic axons in the striatum from injections described in panel e. Original images are on the left and segmented striatum and axon projection fields are on the right, with traveling axon bundles subtracted (black in right images). (e) Two views of a model thalamus (gray) showing the four thalamic viral injections that produced projections shown in panels c and d. Note that since thalamic projections do not cross the midline in mouse, a single injection spanning the midline was treated as two independent injections (injections 2 and 4). A darker center of each injection site represents the eroded ‘core’ of each injection defined previously for the thalamic injection dataset (Hunnicutt et al., 2014). (f) Projection distributions in the striatum for each of the injections shown in panel e (red and green) aligned and overlaid with the outlines of M1/2 projections in the striatum (yellow) delineated in panel b. (g) Injections were assigned to one or more of four categories based on quantification of the convergent volumes of thalamostriatal and corticostriatal projection fields (see Materials and methods). Inclusion in each category is used, as described in Figure 3—figure supplement 1, to localize the thalamic origins of convergence. (h–i) Fluorescent images of coronal sections through the thalamus, showing injection sites 1, 2, and 4. Insets show the segmented injection sites (solid white line) and the injection site core (dashed white line) (Hunnicutt et al., 2014). The dashed yellow line in panel h insert shows the brain midline. (j–k) Two example coronal sections, approximately corresponding to the position of panels h and i, respectively, of the thalamostriatal confidence maps for M1/2 convergence in panels h and i, respectively (top panels in j and k). The segmented injection sites are overlaid on their corresponding confidence maps (bottom panels in j and k). All scale bars, 1 mm.


