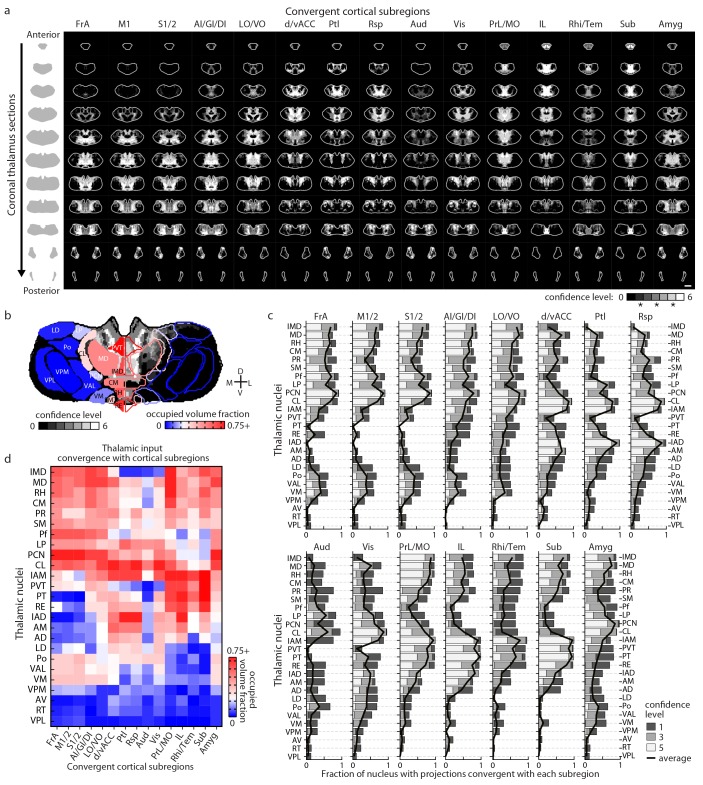
Figure 4. Thalamostriatal projections that converge with subregion-specific corticostriatal projections.
(a) Example coronal sections through our model thalamus from anterior to posterior (starting at −0.155 mm relative to bregma and continuing in 250 µm steps posterior). Confidence maps identifying the complete thalamic origins of thalamostriatal projections that converge with subregion-specific corticostriatal projections (columns). Projection origins indicated for six confidence levels (see Materials and methods, and also see [Hunnicutt et al., 2014]). (b) An example coronal section of the thalamostriatal confidence map converging with corticostriatal inputs of Sub (gray scale), overlaid with thalamic nuclear demarcations from the AMBA. The atlas is colored on the left to indicate the fraction of each thalamic nucleus covered by the average of confidence levels 1, 3, and 5. Coverage values were calculated for the PMBA and AMBA, and their average is shown. The color scale minimum is 0% (blue), inflection point is 25% (white), and the peak coverage is 75% (red). (c) The fraction of each thalamic nucleus covered by confidence levels 1, 3, and 5 (dark, medium and light gray bars, respectively), with their average (black line). (d) Aggregate nucleus coverage map indicating the nuclear origins of the thalamostriatal projections that converge with subregion-specific corticostriatal projections. Nuclei (rows) and cortical subregions (columns) are hierarchically clustered on the basis of output and input similarity, respectively. Color scale is the same as in panel b.

