. 2016 Nov 28;5:e19103. doi: 10.7554/eLife.19103

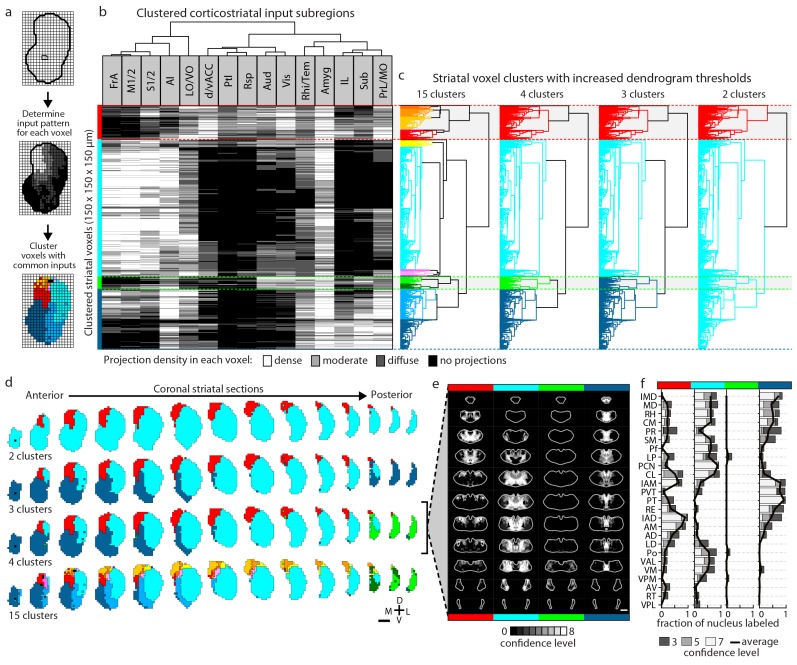
Figure 5. Striatal subdivisions based on cortical input convergence.

(a) Schematic of voxel clustering method. The striatum was downsampled into 150 µm × 150 µm × 150 µm voxels (top panel), the projection density (dense, moderate, or diffuse) to each voxel was determined for inputs from each cortical subregion (middle panel), and the sum of this information was used to cluster voxels with common inputs (bottom panel). (b) All striatal voxels (rows) were hierarchically clustered based on their cortical input patterns, and cortical subregions (columns) were clustered based on common innervation patterns to the striatum. The projection densities in each voxel are indicated in gray scale, as determined in Figure 2b. (c) Four separate thresholds were applied to the voxel dendrogram to produce 2, 3, 4, and 15 clusters. The cluster boundaries (dotted color lines) for the threshold producing four clusters are carried across the clustered voxels in panel b. Clusters containing only one voxel were ignored in our analyses. (d) Coronal sections outline the ipsilateral (according to the injection hemisphere) striatum, starting 1.8 mm anterior to bregma and continuing posterior in 300 µm steps, showing the spatial location of the clusters determined in panel c. (e) Thalamic confidence maps indicating the thalamic origins of thalamostriatal projections to the four striatal subdivisions defined by cluster analysis in panel d (thalamic section positions are the same as in Figure 4a). The method used to localize the origin of thalamic projections was similar to that described for Figures 3 and 4, except that differences in the data resulted in an eight level confidence maps based on the inclusion of each injection in each of four groups (see Materials and methods). (f) The fraction of each thalamic nucleus covered by confidence levels 3, 5, and 7 (dark, medium and light gray bars, respectively), with their average (black line) shown for the confidence maps in panel e (see Figure 5—figure supplement 3 for full dataset, and Materials and methods for details).

DOI: http://dx.doi.org/10.7554/eLife.19103.015

Figure 5.

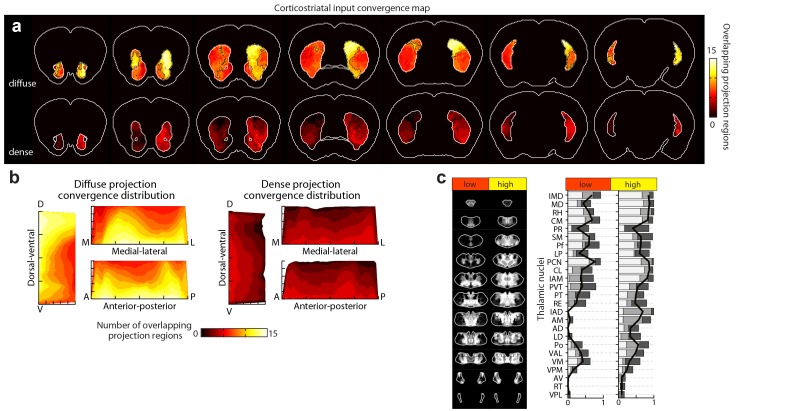
Figure 5—figure supplement 1. Distribution of cortical input convergence in the striatum.

Figure 5—figure supplement 1.

(a) Coronal sections of the average template brain showing the cumulative bilateral convergence of diffuse (top) and dense (bottom) projections from all cortical subregions (heat map). The striatal areas with convergent inputs from nine or more cortical subregions are indicated (black dashed line). Sections start 1.8 mm anterior to bregma, the second slice is 300 µm posterior, and the rest continue in 600 µm steps. (b) Projection distribution plots in the dorsal-ventral (D–V), medial-lateral (M–L) and anterior-posterior (A–P) axes for diffuse (left panel) and dense (right panel) input convergence. Coverage of cortical inputs in the striatum by the indicated number of cortical subregions was calculated in 100 µm steps along each axis. The fraction of the striatum covered in each step by each number of converging projections is shown as a heat map, where each plot is collapsed to show only the dimension indicated (i.e. the D-V plot does not contain any M-L or A-P information). Striatal volumes were normalized in each 100 µm step. (c) Left panel: summary of thalamic confidence maps for the origins of thalamostriatal projections that target striatal volumes with high- and low-diffuse cortical projection convergence, as determined in panel a (thalamic section positions are the same as in Figure 4a). Right panel: the fraction of each thalamic nucleus covered by confidence levels 3, 5, and 7 (dark, medium and light gray bars, respectively), with their average (black line) (see Materials and methods and Figure 5—figure supplement 1).
Figure 5—figure supplement 2. Projection distribution and thalamic input convergence for cortical subtypes.

Figure 5—figure supplement 2.

(a) Coronal sections of the model brain showing the bilateral distributions of dense, moderate and diffuse projections from all allocortical (top), mesocortical (middle), and neocortical (bottom) subregions. The second slice is 300 µm posterior to the first slice, continuing in 600 µm steps. (b) Thalamic confidence maps for the origins of thalamostriatal projections that converge in the striatum with projections from each cortical subtype, as determined in panel a (section positions are the same as in Figure 4a). (c) The fraction of each thalamic nucleus covered by confidence levels 3, 5 and 7 (dark, mid and light gray bars, respectively), and their average (black line).
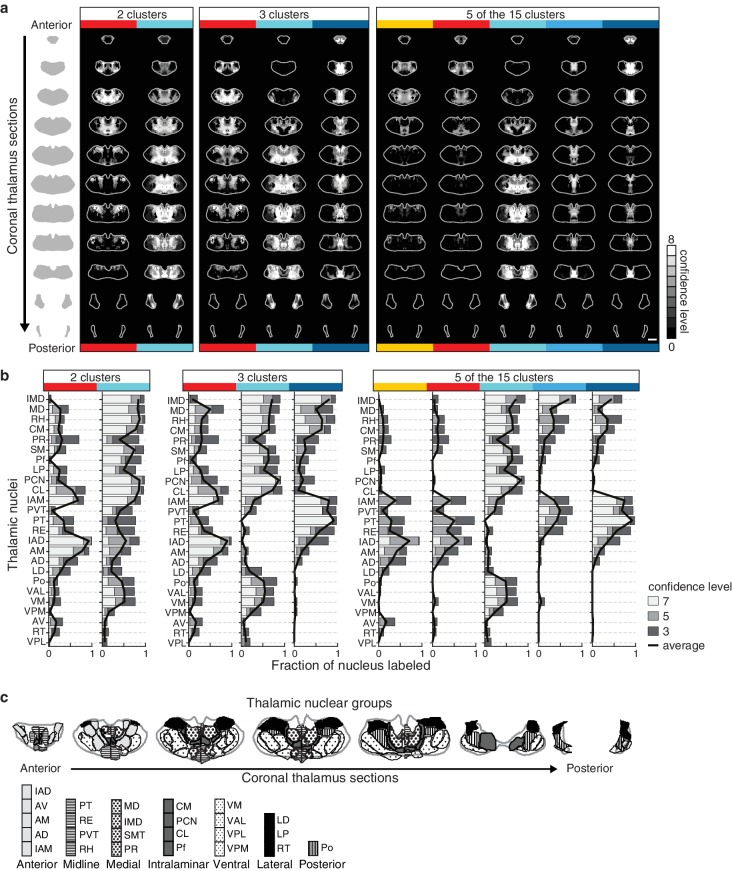
Figure 5—figure supplement 3. Thalamic origins of inputs to striatal clusters.

Figure 5—figure supplement 3.

(a) Coronal sections through the thalamus from anterior to posterior. Thalamic confidence maps indicating the origins of thalamostriatal projections to the striatal voxel clusters shown in Figure 5. Confidence maps are shown for the origins of all projections to each of the two clusters (left), three clusters (middle), and the 5 largest of the 15 clusters (right) thresholds (grayscale, section positions are the same as in Figure 4a). (b) The fraction of each thalamic nucleus covered by confidence levels 3, 5, and 7 (dark, mid, and light gray bars, respectively), with their average (black line) is shown for the confidence maps in panel a (see Materials and methods for details). (c) Coronal sections of the thalamus showing the boundaries of the canonical thalamic nuclear groups (anterior, midline, medial, intralaminar, ventral, lateral, and posterior). In each section, the nuclear boundaries are shown for both the PMBA (left) and the AMBA (right), which were previously aligned to the thalamic dataset used there (Hunnicutt et al., 2014).
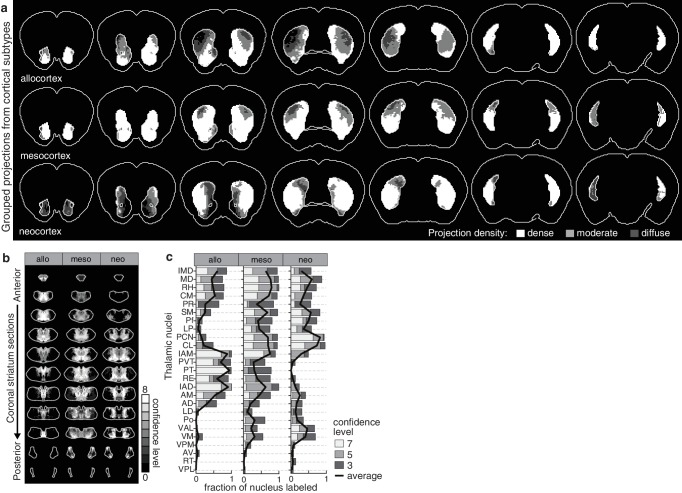
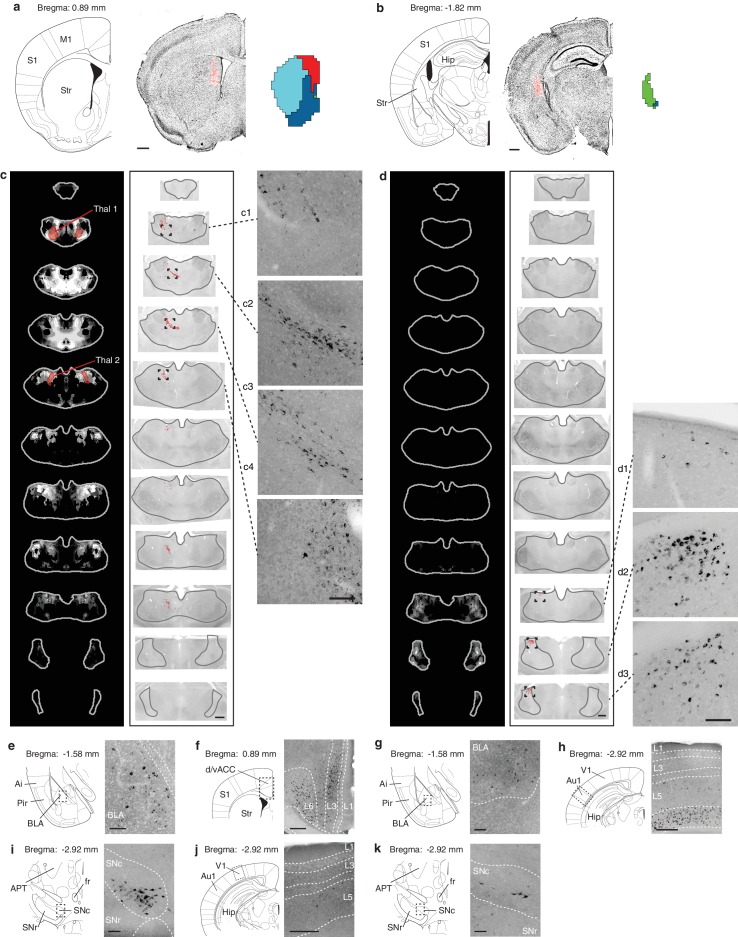
Figure 5—figure supplement 4. Retrograde verification of anterograde projection maps.

Figure 5—figure supplement 4.

(a–b) Representative injection sites of Lumafluor retrograde beads in the dorsomedial (DMS, a) and posterior striatum (PS, b). Left, reference coronal section from PMBA; center, immunostained sections (gray, inverted lookup table) with Lumafluor beads (red); and right, the striatal subdivisions (DMS, red; PS, green) based on Figure 5. (c–k) Retrograde-labeled cells in the thalamus, midbrain, and several other subcortical regions, as indicated after injection of DMS (c, e, f, i, j) and PS (d, g, h, k). (cd) Left, thalamic confidence maps indicating the thalamic origins of the thalamostriatal projections to DMS and PS, as shown in Figure 5. Thal1 and Thal2, red, were used for optogenetic stimulation of thalamostriatal projections to the DMS (Figure 8); center, corresponding coronal sections (gray, inverted lookup table) of the thalamus with retrograde-labeled cells (red dots) and thalamus outline (grey line); right, enlarged raw images corresponding to the boxed areas in center. (ek) Retrograde labeled observed in the basolateral amygdala (BLA, e, g), dorsal/ventral anterior cingulate cortex (d/vACC, f), primary auditory cortex (Au1, h), substantia nigra pars compacta (SNc, i, k), and primary visual cortex (V1, j). Left, reference sections from PMBA, right, immunostaining of retrograde-labeled cells (gray, inverted lookup table). Ai, agranular insular cortex; APT, anterior pretectal nucleus; fr, fasciculus retroflexus; Hip, hippocampus; L1-6, cortical layer 1–6; Pir, piriform cortex; S1, primary somatosensory cortex; SNr, substanta nigra reticulare; Str, striatum. Scale bars: ad, 500 µm; c1c4 and d1d3, 100 µm; e, g, i, k, 100 µm; f, h, j, 250 µm.
HHS Vulnerability Disclosure