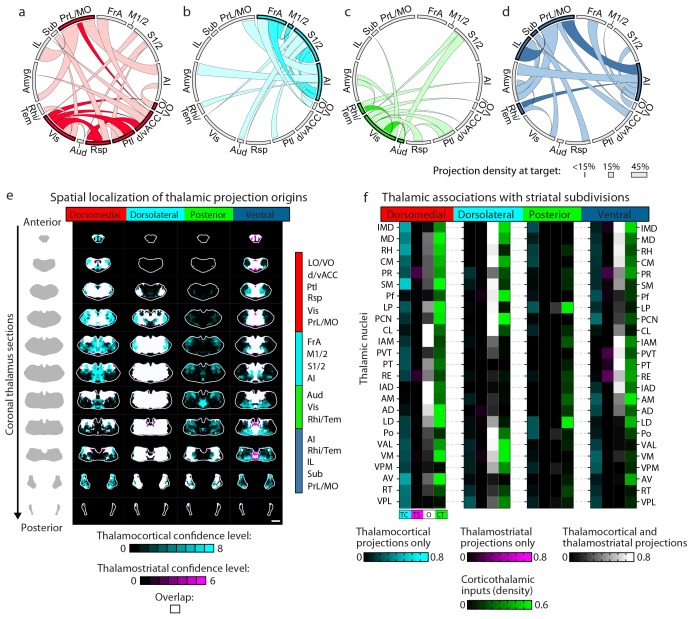
Figure 7. Cortico-thalamo-basal ganglia circuit organization for striatal subdivisions.
(a–d) Chord diagrams highlighting the relationships between the cortical subregions forming the primary inputs to the (a) dorsomedial, (b) dorsolateral, (c) posterior, and (d) ventral striatal subdivisions respectively. The projection density at the target subregion is indicated by the width of the arc at the target. Corticocortical connections are shown for the afferent and efferent projections of subregions that form the primary input to each striatal subdivision. Primary input regions are shown in darker colors. Darker colored ribbons indicate connections between two primary input subregions, and lighter colored ribbons indicate the connections of a primary input subregion with secondary cortical subregions that do not project to the corresponding striatal subdivision. Connections are shown for projections with a density >15% in the target area. (e) Example coronal sections through the thalamus from anterior to posterior with overlaid thalamocortical and thalamostriatal confidence maps, as described in Figure 5. Each column shows the origin of thalamic projections associated with the four striatal subdivisions shown in Figure 5. Thalamocortical and corticothalamic projections are grouped across the cortical subregions that form the primary inputs of each striatal subdivision, as determined in Figure 7—figure supplement 1 (section positions are the same as in Figure 4a). (f) Nuclear localization for the convergence confidence maps shown in panel e. Values are represented as the fraction of each thalamic nucleus covered by the average of confidence levels 1, 3, and 5 for thalamostriatal projections (magenta), the average of confidence levels 1, 4, and 7 for thalamocortical projections (cyan) and the average of confidence levels 1, 3, and 5 for thalamostriatal projections that lie within the white overlapping volume shown in panel e. The density of subregion-specific corticostriatal projections within each nucleus is shown in green (See Materials and methods for details). TC: thalamocortical confidence maps; TS: thalamostriatal confidence maps; O: overlay of thalamocortical and thalamostriatal confidence maps; CT: corticothalamic projections.


