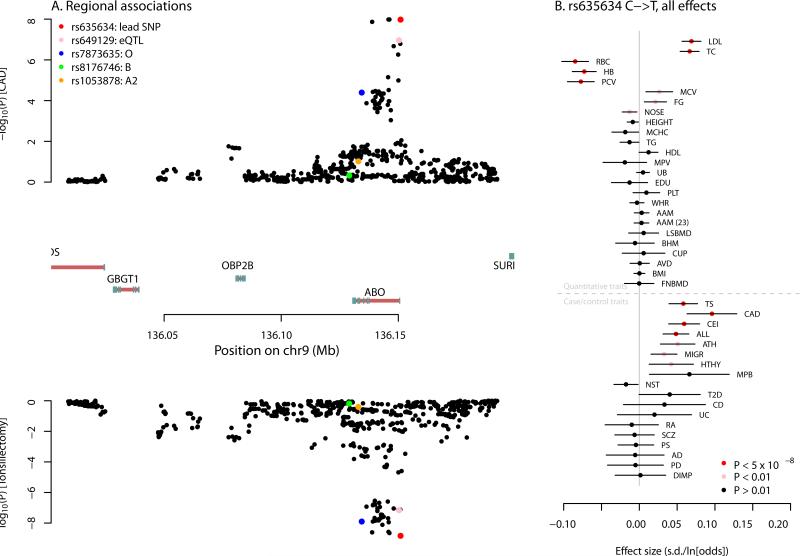
Figure 3. Multiple associations near the ABO gene. A. Association signals for coronary artery disease and tonsillectomy.
In the top panel, we show the P-values for association with coronary artery disease for variants in the window around the ABO gene. In the bottom panel are the P-values for association with tonsillectomy. In both panels, SNPs that tag functionally-important alleles at ABO are in color. In the middle are the gene models in the region–exons are denoted by blue boxes, and introns with red lines. Note that the ABO gene is transcribed on the negative strand. B. Association effect sizes for rs635634 on all tested traits. Shown are the effect size estimates for rs635634 for all traits. The lines represent 95% confidence intervals. Traits are grouped according to whether they are quantitative traits (in which case the x-axis is in units of standard deviations) or case/control traits (in which case the x-axis is in units of log-odds).

