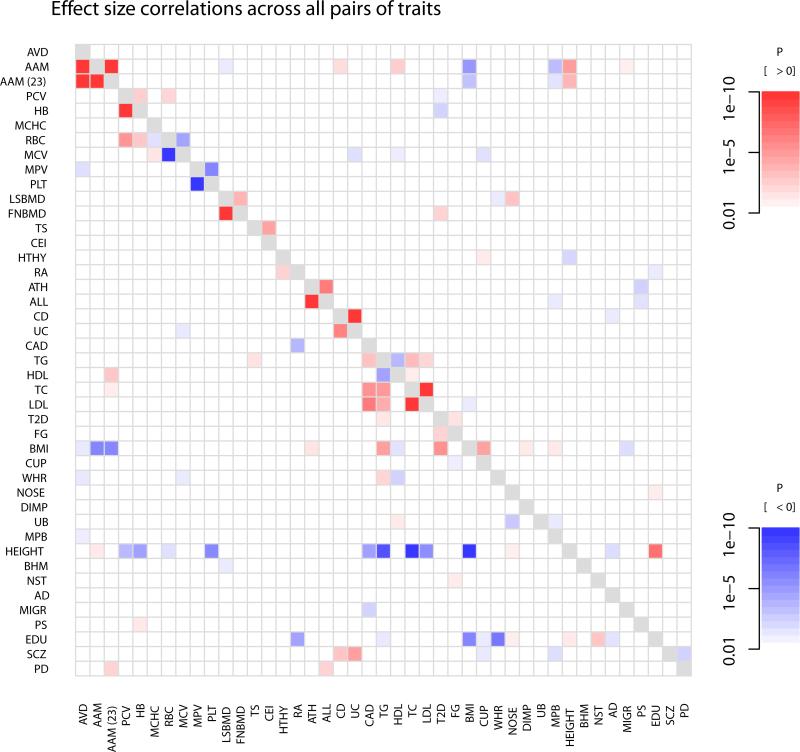
Figure 4. Heatmap showing patterns of correlated effect sizes of variants across pairs of traits.
For each pair of traits [i,j], we extracted the set of variants that influence trait i and their effect sizes on both i and j. We then calculated Spearman's rank correlation between the effect sizes on i and the effect sizes on j, and tested whether this correlation was significantly different from zero. Shown in color are all pairs where this test had a P-value less than 0.01. Darker colors correspond to smaller P-values, and the color corresponds to the direction of the correlation (in red are positive correlations and in blue are negative correlations). The phenotypes are in the same order as in Figure 2. For a comparison to genome-wide genetic correlations, see Supplementary Figure 13.

