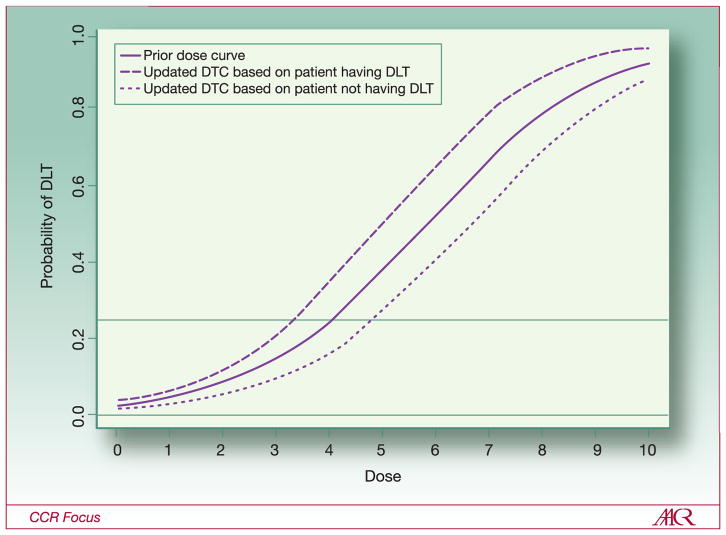
Figure 2.
Theoretical dose-toxicity curves for continuous reassessment method with one patient per cohort. Solid line shows the prior dose-toxicity curve from which the dose for the first patient is selected. With a desired DLT rate of 0.25, the dose level for the first patient is level 4. The dashed line shows the estimated dose-toxicity curve after observing the first patient if the first patient experienced a DLT. If the first patient experienced a DLT at level 4, then patient 2 would receive dose level 3. The dotted line shows the estimated dose-toxicity curve if the first patient did not experience at DLT at level 4; patient 2 would receive dose level 5.

