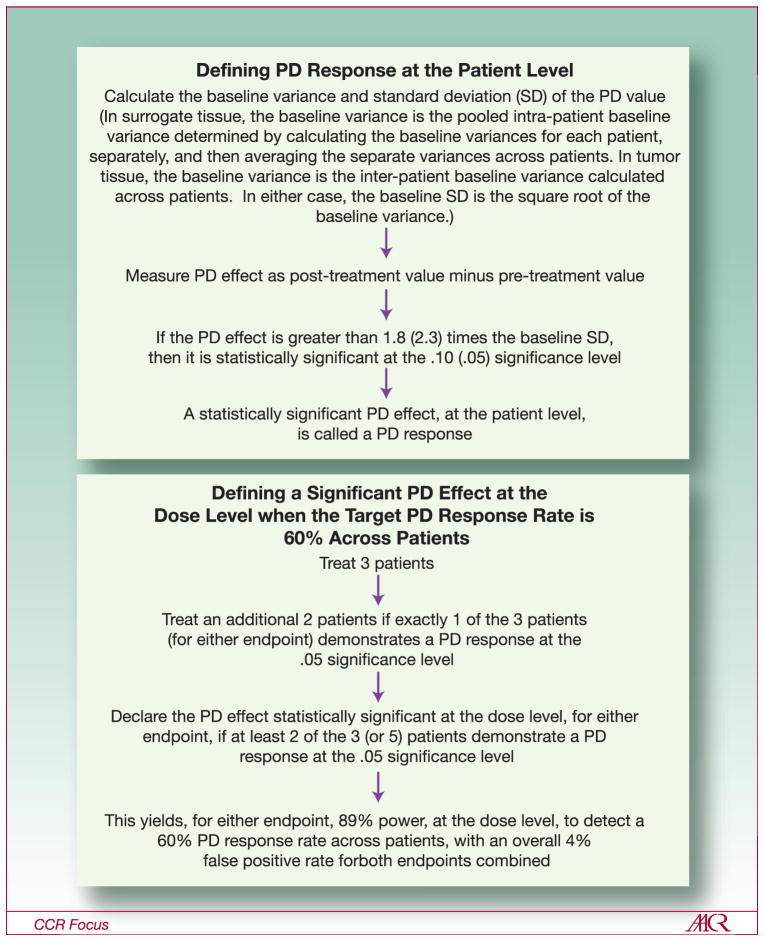
Figure 4.
(Top panel) Definition of PD “response” for an individual patient. Multipliers of the baseline SD are derived from asymptotic normal distribution theory. Significance levels are 1-sided. (Bottom panel) Definition of a promising observed response rate for a dose level with a 2-stage design. The target (true) PD response rate, across patients, is 60%. Power and false positive rate are derived from the binomial distribution. Adapted with permission from Murgo, et al (41)

